Citibank 2014 Annual Report Download - page 5
Download and view the complete annual report
Please find page 5 of the 2014 Citibank annual report below. You can navigate through the pages in the report by either clicking on the pages listed below, or by using the keyword search tool below to find specific information within the annual report.-
 1
1 -
 2
2 -
 3
3 -
 4
4 -
 5
5 -
 6
6 -
 7
7 -
 8
8 -
 9
9 -
 10
10 -
 11
11 -
 12
12 -
 13
13 -
 14
14 -
 15
15 -
 16
16 -
17
-
18
-
19
-
20
-
21
-
22
-
23
-
24
-
25
-
26
-
27
-
28
-
29
-
30
-
31
-
32
-
33
-
34
-
35
-
36
-
37
-
38
-
39
-
40
-
41
-
42
-
43
-
44
-
45
-
46
-
47
-
48
-
49
-
50
-
51
-
52
-
53
-
54
-
55
-
56
-
57
-
58
-
59
-
60
-
61
-
62
-
63
-
64
-
65
-
66
-
67
-
68
-
69
-
70
-
71
-
72
-
73
-
74
-
75
-
76
-
77
-
78
-
79
-
80
-
81
-
82
-
83
-
84
-
85
-
86
-
87
-
88
-
89
-
90
-
91
-
92
-
93
-
94
-
95
-
96
-
97
-
98
-
99
-
100
-
101
-
102
-
103
-
104
-
105
-
106
-
107
-
108
-
109
-
110
-
111
-
112
-
113
-
114
-
115
-
116
-
117
-
118
-
119
-
120
-
121
-
122
-
123
-
124
-
125
-
126
-
127
-
128
-
129
-
130
-
131
-
132
-
133
-
134
-
135
-
136
-
137
-
138
-
139
-
140
-
141
-
142
-
143
-
144
-
145
-
146
-
147
-
148
-
149
-
150
-
151
-
152
-
153
-
154
-
155
-
156
-
157
-
158
-
159
-
160
-
161
-
162
-
163
-
164
-
165
-
166
-
167
-
168
-
169
-
170
-
171
-
172
-
173
-
174
-
175
-
176
-
177
-
178
-
179
-
180
-
181
-
182
-
183
-
184
-
185
-
186
-
187
-
188
-
189
-
190
-
191
-
192
-
193
-
194
-
195
-
196
-
197
-
198
-
199
-
200
-
201
-
202
-
203
-
204
-
205
-
206
-
207
-
208
-
209
-
210
-
211
-
212
-
213
-
214
-
215
-
216
-
217
-
218
-
219
-
220
-
221
-
222
-
223
-
224
-
225
-
226
-
227
-
228
-
229
-
230
-
231
-
232
-
233
-
234
-
235
-
236
-
237
-
238
-
239
-
240
-
241
-
242
-
243
-
244
-
245
-
246
-
247
-
248
-
249
-
250
-
251
-
252
-
253
-
254
-
255
-
256
-
257
-
258
-
259
-
260
-
261
-
262
-
263
-
264
-
265
-
266
-
267
-
268
-
269
-
270
-
271
-
272
-
273
-
274
-
275
-
276
-
277
-
278
-
279
-
280
-
281
-
282
-
283
-
284
-
285
-
286
-
287
-
288
-
289
-
290
-
291
-
292
-
293
-
294
-
295
-
296
-
297
-
298
-
299
-
300
-
301
-
302
-
303
-
304
-
305
-
306
-
307
-
308
-
309
-
310
-
311
-
312
-
313
-
314
-
315
-
316
-
317
-
318
-
319
-
320
-
321
-
322
-
323
-
324
-
325
-
326
-
327
 |
 |

Letter to Shareholders
Regarding the fourth goal — becoming known as indisputably
strong and stable — our capital, liquidity and other numbers
speak, loudly, to the substantial progress we’ve made. In 2014
alone — and despite significant legal charges — we were able
to generate $11 billion in regulatory capital, bringing the total
to $31 billion over the last two years. Our capital, leverage
and liquidity ratios each increased over the course of 2014.
Beyond the numbers, we’ve also made considerable progress
toward strengthening the foundational pillars of this firm:
governance, culture, controls and technology. We established
a consistent framework for assessing performance — of
businesses, functions and, above all, people — through our
balanced scorecard system, which includes culture and
control metrics, as well as through our quarterly reviews that
I conduct in person. We took 14 legacy anti-money-laundering
monitoring platforms and consolidated them into one. And
we’ve built a globally consistent approach to ethics training
and set global standards for suitability and sales practices.
However, despite this progress, last year we uncovered a
fraud in Mexico and the Federal Reserve found significant
issues with our capital planning processes. We continue to
invest in our Risk, Audit and Compliance functions — not
simply in response to Mexico but as part of a broader effort
to ensure that our controls and processes are among the
very best in the industry.
Regarding our capital plan, we spent the bulk of 2014 in
close consultation with Federal Reserve officials to address
their concerns. We invested in and strengthened our risk
identification and scenario designs, improved our models,
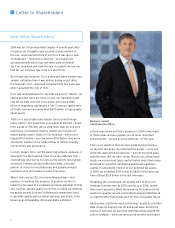
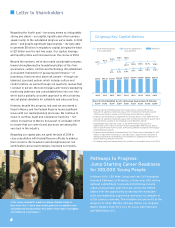
Citi’s Jamie Anzellotti mentors college student Anika in
New York City: “I have seen Anika grow into a confident and
accomplished young woman who knows that today’s struggles
are tomorrow’s successes.”
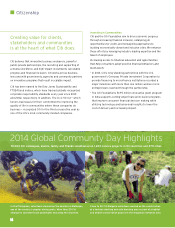
Pathways to Progress:
Jump-Starting Career Readiness
for 100,000 Young People
In March 2014, CEO Mike Corbat and the Citi Foundation
launched Pathways to Progress, a three-year, $50 million
national commitment to provide 100,000 low-income
urban young people, ages 16 to 24, across the United
States with the opportunity to develop the workplace
skills and leadership experience necessary to compete in
a 21st century economy. The initiative focuses on 10 of the
largest U.S. cities: Boston, Chicago, Dallas, Los Angeles,
Miami, Newark, New York City, St. Louis, San Francisco
and Washington, D.C.
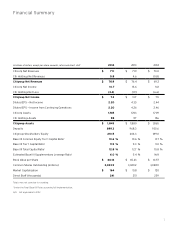
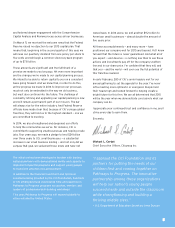
$51.19 $52.35 $53.10 $54.52 $55.31 $56.40 $56.89 $57.53 $56.83
4Q’12
8.7%
10.0%
9.3%
1Q’13 2Q’13 3Q’13 4Q’13 1Q’14 2Q’14 4Q’143Q’14
10.5% 10.6%
10.1%
4
10.5% 10.6% 10.7% 10.6%
TBV/Share
3
Basel III Common Equity
Tier 1 Capital Ratio
1
Basel III Supplementary
Leverage Ratio
2
Basel III Risk-Weighted Assets (Advanced Approaches) ($ Billions)
$1,206 $1,192 $1,168 $1,159 $1,186 $1,261 $1,281 $1,302 $1,293
5
5.1% 5.3% 5.4% 5.7% 5.8% 6.0% 6.0%
1 Citigroup’s Basel III Common Equity Tier 1 Capital ratio is a non-GAAP financial
measure. For additional information, please refer to Slide 40 of the Fourth Quarter
2014 Earnings Review available on the Citigroup Investor Relations website.
2 Citigroup’s estimated Basel III Supplementary Leverage Ratio is a non-GAAP financial
measure. For additional information, please refer to Slide 41 of the Fourth Quarter 2014
Earnings Review available on the Citigroup Investor Relations website.
3 Tangible Book Value (TBV) per share is a non-GAAP financial measure. For a
reconciliation of this metric to the most directly comparable GAAP measure, please
refer to Slide 41 of the Fourth Quarter 2014 Earnings Review available on the Citigroup
Investor Relations website.
4 Citigroup’s estimated Basel III Common Equity Tier 1 Capital ratio at December 31, 2013
reflects an adjustment to include, on a pro forma basis, approximately $56 billion of
additional operational risk-weighted assets related to its approved exit from Basel III
parallel reporting, effective with 2Q’14.
5 Citi Holdings comprised approximately 14% of Basel III risk-weighted assets as of 4Q’14.
Citigroup Key Capital Metrics
4