Citibank 2014 Annual Report Download - page 69
Download and view the complete annual report
Please find page 69 of the 2014 Citibank annual report below. You can navigate through the pages in the report by either clicking on the pages listed below, or by using the keyword search tool below to find specific information within the annual report.-
 1
1 -
2
-
3
-
4
-
5
-
6
-
7
-
8
-
9
-
10
-
11
-
12
-
13
-
14
-
15
-
16
-
17
-
18
-
19
-
20
-
21
-
22
-
23
-
24
-
25
-
26
-
27
-
28
-
29
-
30
-
31
-
32
-
33
-
34
-
35
-
36
-
37
-
38
-
39
-
40
-
41
-
42
-
43
-
44
-
45
-
46
-
47
-
48
-
49
-
50
-
51
-
52
-
53
-
54
-
55
-
56
-
57
-
58
-
 59
59 -
 60
60 -
 61
61 -
 62
62 -
 63
63 -
 64
64 -
 65
65 -
 66
66 -
 67
67 -
 68
68 -
 69
69 -
 70
70 -
 71
71 -
 72
72 -
 73
73 -
 74
74 -
 75
75 -
 76
76 -
 77
77 -
 78
78 -
 79
79 -
80
-
81
-
82
-
83
-
84
-
85
-
86
-
87
-
88
-
89
-
90
-
91
-
92
-
93
-
94
-
95
-
96
-
97
-
98
-
99
-
100
-
101
-
102
-
103
-
104
-
105
-
106
-
107
-
108
-
109
-
110
-
111
-
112
-
113
-
114
-
115
-
116
-
117
-
118
-
119
-
120
-
121
-
122
-
123
-
124
-
125
-
126
-
127
-
128
-
129
-
130
-
131
-
132
-
133
-
134
-
135
-
136
-
137
-
138
-
139
-
140
-
141
-
142
-
143
-
144
-
145
-
146
-
147
-
148
-
149
-
150
-
151
-
152
-
153
-
154
-
155
-
156
-
157
-
158
-
159
-
160
-
161
-
162
-
163
-
164
-
165
-
166
-
167
-
168
-
169
-
170
-
171
-
172
-
173
-
174
-
175
-
176
-
177
-
178
-
179
-
180
-
181
-
182
-
183
-
184
-
185
-
186
-
187
-
188
-
189
-
190
-
191
-
192
-
193
-
194
-
195
-
196
-
197
-
198
-
199
-
200
-
201
-
202
-
203
-
204
-
205
-
206
-
207
-
208
-
209
-
210
-
211
-
212
-
213
-
214
-
215
-
216
-
217
-
218
-
219
-
220
-
221
-
222
-
223
-
224
-
225
-
226
-
227
-
228
-
229
-
230
-
231
-
232
-
233
-
234
-
235
-
236
-
237
-
238
-
239
-
240
-
241
-
242
-
243
-
244
-
245
-
246
-
247
-
248
-
249
-
250
-
251
-
252
-
253
-
254
-
255
-
256
-
257
-
258
-
259
-
260
-
261
-
262
-
263
-
264
-
265
-
266
-
267
-
268
-
269
-
270
-
271
-
272
-
273
-
274
-
275
-
276
-
277
-
278
-
279
-
280
-
281
-
282
-
283
-
284
-
285
-
286
-
287
-
288
-
289
-
290
-
291
-
292
-
293
-
294
-
295
-
296
-
297
-
298
-
299
-
300
-
301
-
302
-
303
-
304
-
305
-
306
-
307
-
308
-
309
-
310
-
311
-
312
-
313
-
314
-
315
-
316
-
317
-
318
-
319
-
320
-
321
-
322
-
323
-
324
-
325
-
326
-
327
 |
 |

52
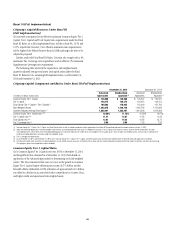
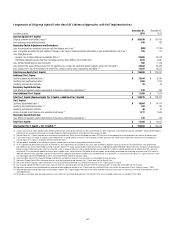
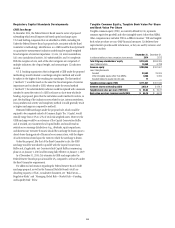
The following table sets forth Citi’s estimated Basel III Supplementary Leverage ratio and related components, under the Revised Final Basel III Rules, for the
three months ended December 31, 2014 and December 31, 2013.
Citigroup Estimated Basel III Supplementary Leverage Ratios and Related Components (1)
In millions of dollars, except ratios
December 31,
2014
December 31,
2013 (2)
Tier 1 Capital $ 148,275 $ 133,412
Total Leverage Exposure (TLE)
On-balance sheet assets (3) $1,899,955 $1,886,613
Certain off-balance sheet exposures: (4)
Potential future exposure (PFE) on derivative contracts 240,712 240,534
Effective notional of sold credit derivatives, net (5) 96,869 102,061
Counterparty credit risk for repo-style transactions (6) 21,894 26,035
Unconditionally cancellable commitments 61,673 63,782
Other off-balance sheet exposures 229,672 210,571
Total of certain off-balance sheet exposures $ 650,820 $ 642,983
Less: Tier 1 Capital deductions 64,458 73,590
Total Leverage Exposure $2,486,317 $2,456,006
Supplementary Leverage ratio 5.96% 5.43%
(1) Citi’s estimated Basel III Supplementary Leverage ratio and certain related components are non-GAAP financial measures. Citi believes this ratio and its components provide useful information to investors and others by
measuring Citigroup’s progress against future regulatory capital standards.
(2) Pro forma presentation based on application of the Revised Final Basel III Rules consistent with current period presentation.
(3) Represents the daily average of on-balance sheet assets for the quarter.
(4) Represents the average of certain off-balance sheet exposures calculated as of the last day of each month in the quarter.
(5) Under the Revised Final Basel III Rules, banking organizations are required to include in TLE the effective notional amount of sold credit derivatives, with netting of exposures permitted if certain conditions are met.
(6) Repo-style transactions include repurchase or reverse repurchase transactions and securities borrowing or securities lending transactions.
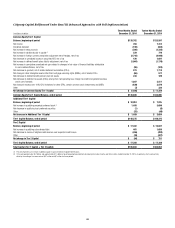
Citigroup’s estimated Basel III Supplementary Leverage ratio under
the Revised Final Basel III Rules was 6.0% for the fourth quarter of 2014,
unchanged from the third quarter of 2014, and increased from 5.4% for the
fourth quarter of 2013 (on a pro forma basis to conform to current period
presentation). Citi’s estimated Basel III Supplementary Leverage ratio
remained unchanged quarter-over-quarter as the Tier 1 Capital benefits
resulting from preferred stock issuances and a decrease in goodwill were
offset by a decrease in Accumulated other comprehensive income (loss),
with Total Leverage Exposure also remaining substantially unchanged.
The growth in the ratio from the fourth quarter of 2013 was principally
driven by an increase in Tier 1 Capital attributable largely to net income of
$7.3 billion, approximately $3.3 billion of DTA utilization and approximately
$3.7 billion of perpetual preferred stock issuances, offset in part by a
reduction in Accumulated other comprehensive income (loss) and a
marginal increase in Total Leverage Exposure.
Citibank, N.A.’s estimated Basel III Supplementary Leverage ratio under
the Revised Final Basel III Rules was 6.3% for the fourth quarter of 2014,
unchanged from the third quarter of 2014 and, on a pro forma basis, from
the fourth quarter of 2013. Tier 1 Capital benefits resulting from quarterly
and annual net income and DTA utilization were largely offset by an
increase in Total Leverage Exposure and a reduction in Accumulated other
comprehensive income (loss) and, for the year only, cash dividends paid by
Citibank, N.A. to its parent, Citicorp, and which were subsequently remitted
to Citigroup.