Citibank 2014 Annual Report Download - page 107
Download and view the complete annual report
Please find page 107 of the 2014 Citibank annual report below. You can navigate through the pages in the report by either clicking on the pages listed below, or by using the keyword search tool below to find specific information within the annual report.-
 1
1 -
2
-
3
-
4
-
5
-
6
-
7
-
8
-
9
-
10
-
11
-
12
-
13
-
14
-
15
-
16
-
17
-
18
-
19
-
20
-
21
-
22
-
23
-
24
-
25
-
26
-
27
-
28
-
29
-
30
-
31
-
32
-
33
-
34
-
35
-
36
-
37
-
38
-
39
-
40
-
41
-
42
-
43
-
44
-
45
-
46
-
47
-
48
-
49
-
50
-
51
-
52
-
53
-
54
-
55
-
56
-
57
-
58
-
59
-
60
-
61
-
62
-
63
-
64
-
65
-
66
-
67
-
68
-
69
-
70
-
71
-
72
-
73
-
74
-
75
-
76
-
77
-
78
-
79
-
80
-
81
-
82
-
83
-
84
-
85
-
86
-
87
-
88
-
89
-
90
-
91
-
92
-
93
-
94
-
95
-
96
-
 97
97 -
 98
98 -
 99
99 -
 100
100 -
 101
101 -
 102
102 -
 103
103 -
 104
104 -
 105
105 -
 106
106 -
 107
107 -
 108
108 -
 109
109 -
 110
110 -
 111
111 -
 112
112 -
 113
113 -
 114
114 -
 115
115 -
 116
116 -
 117
117 -
118
-
119
-
120
-
121
-
122
-
123
-
124
-
125
-
126
-
127
-
128
-
129
-
130
-
131
-
132
-
133
-
134
-
135
-
136
-
137
-
138
-
139
-
140
-
141
-
142
-
143
-
144
-
145
-
146
-
147
-
148
-
149
-
150
-
151
-
152
-
153
-
154
-
155
-
156
-
157
-
158
-
159
-
160
-
161
-
162
-
163
-
164
-
165
-
166
-
167
-
168
-
169
-
170
-
171
-
172
-
173
-
174
-
175
-
176
-
177
-
178
-
179
-
180
-
181
-
182
-
183
-
184
-
185
-
186
-
187
-
188
-
189
-
190
-
191
-
192
-
193
-
194
-
195
-
196
-
197
-
198
-
199
-
200
-
201
-
202
-
203
-
204
-
205
-
206
-
207
-
208
-
209
-
210
-
211
-
212
-
213
-
214
-
215
-
216
-
217
-
218
-
219
-
220
-
221
-
222
-
223
-
224
-
225
-
226
-
227
-
228
-
229
-
230
-
231
-
232
-
233
-
234
-
235
-
236
-
237
-
238
-
239
-
240
-
241
-
242
-
243
-
244
-
245
-
246
-
247
-
248
-
249
-
250
-
251
-
252
-
253
-
254
-
255
-
256
-
257
-
258
-
259
-
260
-
261
-
262
-
263
-
264
-
265
-
266
-
267
-
268
-
269
-
270
-
271
-
272
-
273
-
274
-
275
-
276
-
277
-
278
-
279
-
280
-
281
-
282
-
283
-
284
-
285
-
286
-
287
-
288
-
289
-
290
-
291
-
292
-
293
-
294
-
295
-
296
-
297
-
298
-
299
-
300
-
301
-
302
-
303
-
304
-
305
-
306
-
307
-
308
-
309
-
310
-
311
-
312
-
313
-
314
-
315
-
316
-
317
-
318
-
319
-
320
-
321
-
322
-
323
-
324
-
325
-
326
-
327
 |
 |

90
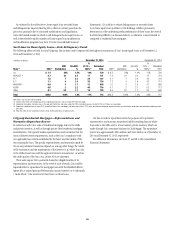
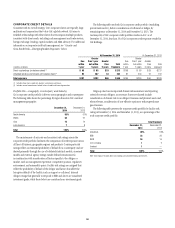
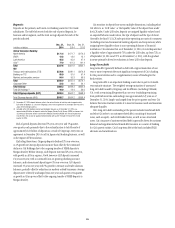
CORPORATE CREDIT DETAILS
Consistent with its overall strategy, Citi’s corporate clients are typically large,
multinational corporations that value Citi’s global network. Citi aims to
establish relationships with these clients that encompass multiple products,
consistent with client needs, including cash management and trade services,
foreign exchange, lending, capital markets and M&A advisory. For additional
information on corporate credit risk management, see “Country and
Cross-Border Risk—Emerging Markets Exposures” below.
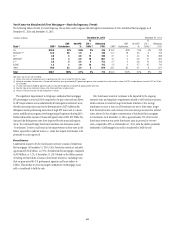
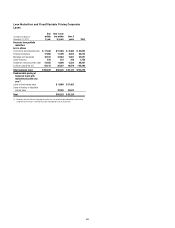
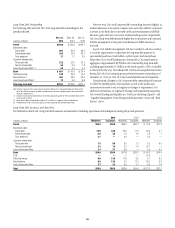
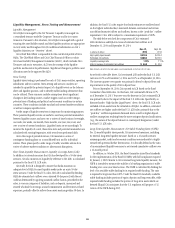
The following table sets forth Citi’s corporate credit portfolio (excluding
private bank in ICG), before consideration of collateral or hedges, by
remaining tenor at December 31, 2014 and December 31, 2013. The
vast majority of Citi’s corporate credit portfolio resides in ICG; as of
December 31, 2014, less than 1% of Citi’s corporate credit exposure resided in
Citi Holdings.
At December 31, 2014 At December 31, 2013
In billions of dollars
Due
within
1 year
Greater
than 1 year
but within
5 years
Greater
than
5 years
Total
Exposure
Due
within
1 year
Greater
than 1 year
but within
5 years
Greater
than
5 years
Total
exposure
Direct outstandings (on-balance sheet) (1) $ 95 $ 85 $33 $ 213 $ 108 $ 80 $ 29 $ 217
Unfunded lending commitments (off-balance sheet) (2) 92 207 33 332 87 204 21 312
Total exposure $ 187 $ 292 $66 $ 545 $ 195 $ 284 $ 50 $ 529
(1) Includes drawn loans, overdrafts, bankers’ acceptances and leases.
(2) Includes unused commitments to lend, letters of credit and financial guarantees.
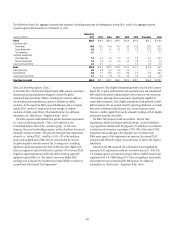
Portfolio Mix—Geography, Counterparty and Industry
Citi’s corporate credit portfolio is diverse across geography and counterparty.
The following table shows the percentage by region based on Citi’s internal
management geography:
December 31,
2014
December 31,
2013
North America 55% 51%
EMEA 25 27
Asia 13 14
Latin America 78
Total 100% 100%
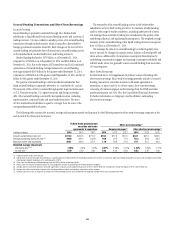
The maintenance of accurate and consistent risk ratings across the
corporate credit portfolio facilitates the comparison of credit exposure across
all lines of business, geographic regions and products. Counterparty risk
ratings reflect an estimated probability of default for a counterparty and are
derived primarily through the use of validated statistical models, scorecard
models and external agency ratings (under defined circumstances),
in combination with consideration of factors specific to the obligor or
market, such as management experience, competitive position, regulatory
environment and commodity prices. Facility risk ratings are assigned that
reflect the probability of default of the obligor and factors that affect the
loss-given-default of the facility, such as support or collateral. Internal
obligor ratings that generally correspond to BBB and above are considered
investment grade, while those below are considered non-investment grade.
Citigroup also has incorporated climate risk assessment and reporting
criteria for certain obligors, as necessary. Factors evaluated include
consideration of climate risk to an obligor’s business and physical assets and,
when relevant, consideration of cost-effective options to reduce greenhouse
gas emissions.
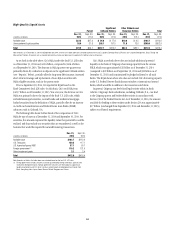
The following table presents the corporate credit portfolio by facility risk
rating at December 31, 2014 and December 31, 2013, as a percentage of the
total corporate credit portfolio:
Total Exposure
December 31,
2014
December 31,
2013
AAA/AA/A 49% 52%
BBB 33 30
BB/B 16 16
CCC or below 12
Unrated 1—
Total 100% 100%
Note: Total exposure includes direct outstandings and unfunded lending commitments.