Citibank 2014 Annual Report Download - page 191
Download and view the complete annual report
Please find page 191 of the 2014 Citibank annual report below. You can navigate through the pages in the report by either clicking on the pages listed below, or by using the keyword search tool below to find specific information within the annual report.-
 1
1 -
2
-
3
-
4
-
5
-
6
-
7
-
8
-
9
-
10
-
11
-
12
-
13
-
14
-
15
-
16
-
17
-
18
-
19
-
20
-
21
-
22
-
23
-
24
-
25
-
26
-
27
-
28
-
29
-
30
-
31
-
32
-
33
-
34
-
35
-
36
-
37
-
38
-
39
-
40
-
41
-
42
-
43
-
44
-
45
-
46
-
47
-
48
-
49
-
50
-
51
-
52
-
53
-
54
-
55
-
56
-
57
-
58
-
59
-
60
-
61
-
62
-
63
-
64
-
65
-
66
-
67
-
68
-
69
-
70
-
71
-
72
-
73
-
74
-
75
-
76
-
77
-
78
-
79
-
80
-
81
-
82
-
83
-
84
-
85
-
86
-
87
-
88
-
89
-
90
-
91
-
92
-
93
-
94
-
95
-
96
-
97
-
98
-
99
-
100
-
101
-
102
-
103
-
104
-
105
-
106
-
107
-
108
-
109
-
110
-
111
-
112
-
113
-
114
-
115
-
116
-
117
-
118
-
119
-
120
-
121
-
122
-
123
-
124
-
125
-
126
-
127
-
128
-
129
-
130
-
131
-
132
-
133
-
134
-
135
-
136
-
137
-
138
-
139
-
140
-
141
-
142
-
143
-
144
-
145
-
146
-
147
-
148
-
149
-
150
-
151
-
152
-
153
-
154
-
155
-
156
-
157
-
158
-
159
-
160
-
161
-
162
-
163
-
164
-
165
-
166
-
167
-
168
-
169
-
170
-
171
-
172
-
173
-
174
-
175
-
176
-
177
-
178
-
179
-
180
-
 181
181 -
 182
182 -
 183
183 -
 184
184 -
 185
185 -
 186
186 -
 187
187 -
 188
188 -
 189
189 -
 190
190 -
 191
191 -
 192
192 -
 193
193 -
 194
194 -
 195
195 -
 196
196 -
 197
197 -
 198
198 -
 199
199 -
 200
200 -
 201
201 -
202
-
203
-
204
-
205
-
206
-
207
-
208
-
209
-
210
-
211
-
212
-
213
-
214
-
215
-
216
-
217
-
218
-
219
-
220
-
221
-
222
-
223
-
224
-
225
-
226
-
227
-
228
-
229
-
230
-
231
-
232
-
233
-
234
-
235
-
236
-
237
-
238
-
239
-
240
-
241
-
242
-
243
-
244
-
245
-
246
-
247
-
248
-
249
-
250
-
251
-
252
-
253
-
254
-
255
-
256
-
257
-
258
-
259
-
260
-
261
-
262
-
263
-
264
-
265
-
266
-
267
-
268
-
269
-
270
-
271
-
272
-
273
-
274
-
275
-
276
-
277
-
278
-
279
-
280
-
281
-
282
-
283
-
284
-
285
-
286
-
287
-
288
-
289
-
290
-
291
-
292
-
293
-
294
-
295
-
296
-
297
-
298
-
299
-
300
-
301
-
302
-
303
-
304
-
305
-
306
-
307
-
308
-
309
-
310
-
311
-
312
-
313
-
314
-
315
-
316
-
317
-
318
-
319
-
320
-
321
-
322
-
323
-
324
-
325
-
326
-
327
 |
 |

174
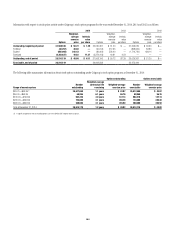
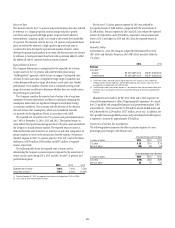
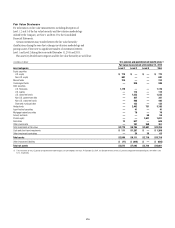
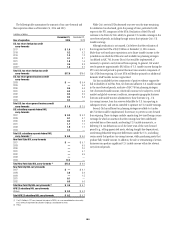
Fair Value Disclosure
For information on fair value measurements, including descriptions of
Level 1, 2 and 3 of the fair value hierarchy and the valuation methodology
utilized by the Company, see Note 1 and Note 25 to the Consolidated
Financial Statements.
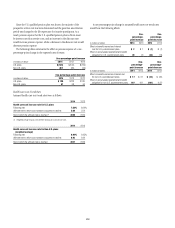
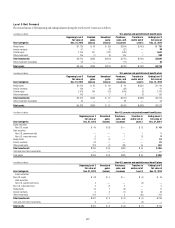
Certain investments may transfer between the fair value hierarchy
classifications during the year due to changes in valuation methodology and
pricing sources. There were no significant transfers of investments between
Level 1 and Level 2 during the years ended December 31, 2014 and 2013.
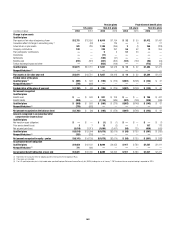
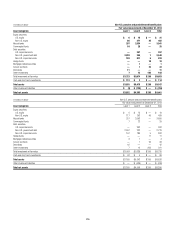
Plan assets by detailed asset categories and the fair value hierarchy are as follows:
In millions of dollars U.S. pension and postretirement benefit plans (1)
Fair value measurement at December 31, 2014
Asset categories Level 1 Level 2 Level 3 Total
Equity securities
U.S. equity $ 773 $ — $ — $ 773
Non-U.S. equity 601 — — 601
Mutual funds 214 — — 214
Commingled funds — 939 — 939
Debt securities
U.S. Treasuries 1,178 — — 1,178
U.S. agency — 113 — 113
U.S. corporate bonds — 1,533 — 1,533
Non-U.S. government debt — 357 — 357
Non-U.S. corporate bonds — 405 — 405
State and municipal debt — 132 — 132
Hedge funds — 2,462 731 3,193
Asset-backed securities — 41 — 41
Mortgage-backed securities — 76 — 76
Annuity contracts — — 59 59
Private equity — — 1,631 1,631
Derivatives 12 637 — 649
Other investments — 101 260 361
Total investments at fair value $2,778 $ 6,796 $ 2,681 $12,255
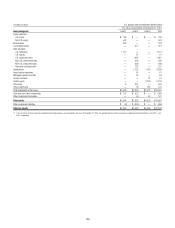
Cash and short-term investments $ 111 $1,287 $ — $ 1,398
Other investment receivables — 28 35 63
Total assets $ 2,889 $ 8,111 $ 2,716 $13,716
Other investment liabilities $ (17) $ (618) $ — $ (635)
Total net assets $ 2,872 $ 7,493 $ 2,716 $13,081
(1) The investments of the U.S. pension and postretirement benefit plans are commingled in one trust. At December 31, 2014, the allocable interests of the U.S. pension and postretirement benefit plans were 99.9% and
0.1%, respectively.