Citibank 2014 Annual Report Download - page 210
Download and view the complete annual report
Please find page 210 of the 2014 Citibank annual report below. You can navigate through the pages in the report by either clicking on the pages listed below, or by using the keyword search tool below to find specific information within the annual report.-
 1
1 -
2
-
3
-
4
-
5
-
6
-
7
-
8
-
9
-
10
-
11
-
12
-
13
-
14
-
15
-
16
-
17
-
18
-
19
-
20
-
21
-
22
-
23
-
24
-
25
-
26
-
27
-
28
-
29
-
30
-
31
-
32
-
33
-
34
-
35
-
36
-
37
-
38
-
39
-
40
-
41
-
42
-
43
-
44
-
45
-
46
-
47
-
48
-
49
-
50
-
51
-
52
-
53
-
54
-
55
-
56
-
57
-
58
-
59
-
60
-
61
-
62
-
63
-
64
-
65
-
66
-
67
-
68
-
69
-
70
-
71
-
72
-
73
-
74
-
75
-
76
-
77
-
78
-
79
-
80
-
81
-
82
-
83
-
84
-
85
-
86
-
87
-
88
-
89
-
90
-
91
-
92
-
93
-
94
-
95
-
96
-
97
-
98
-
99
-
100
-
101
-
102
-
103
-
104
-
105
-
106
-
107
-
108
-
109
-
110
-
111
-
112
-
113
-
114
-
115
-
116
-
117
-
118
-
119
-
120
-
121
-
122
-
123
-
124
-
125
-
126
-
127
-
128
-
129
-
130
-
131
-
132
-
133
-
134
-
135
-
136
-
137
-
138
-
139
-
140
-
141
-
142
-
143
-
144
-
145
-
146
-
147
-
148
-
149
-
150
-
151
-
152
-
153
-
154
-
155
-
156
-
157
-
158
-
159
-
160
-
161
-
162
-
163
-
164
-
165
-
166
-
167
-
168
-
169
-
170
-
171
-
172
-
173
-
174
-
175
-
176
-
177
-
178
-
179
-
180
-
181
-
182
-
183
-
184
-
185
-
186
-
187
-
188
-
189
-
190
-
191
-
192
-
193
-
194
-
195
-
196
-
197
-
198
-
199
-
 200
200 -
 201
201 -
 202
202 -
 203
203 -
 204
204 -
 205
205 -
 206
206 -
 207
207 -
 208
208 -
 209
209 -
 210
210 -
 211
211 -
 212
212 -
 213
213 -
 214
214 -
 215
215 -
 216
216 -
 217
217 -
 218
218 -
 219
219 -
 220
220 -
221
-
222
-
223
-
224
-
225
-
226
-
227
-
228
-
229
-
230
-
231
-
232
-
233
-
234
-
235
-
236
-
237
-
238
-
239
-
240
-
241
-
242
-
243
-
244
-
245
-
246
-
247
-
248
-
249
-
250
-
251
-
252
-
253
-
254
-
255
-
256
-
257
-
258
-
259
-
260
-
261
-
262
-
263
-
264
-
265
-
266
-
267
-
268
-
269
-
270
-
271
-
272
-
273
-
274
-
275
-
276
-
277
-
278
-
279
-
280
-
281
-
282
-
283
-
284
-
285
-
286
-
287
-
288
-
289
-
290
-
291
-
292
-
293
-
294
-
295
-
296
-
297
-
298
-
299
-
300
-
301
-
302
-
303
-
304
-
305
-
306
-
307
-
308
-
309
-
310
-
311
-
312
-
313
-
314
-
315
-
316
-
317
-
318
-
319
-
320
-
321
-
322
-
323
-
324
-
325
-
326
-
327
 |
 |

193
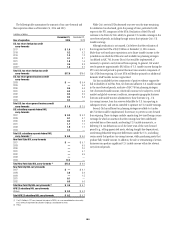
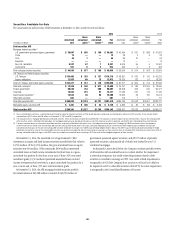
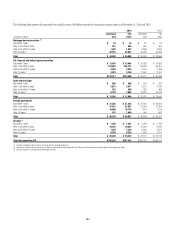
The following table presents the amortized cost and fair value of AFS debt securities by contractual maturity dates as of December 31, 2014 and 2013:
2014 2013
In millions of dollars
Amortized
cost
Fair
value
Amortized
cost
Fair
value
Mortgage-backed securities (1)
Due within 1 year $ 44 $ 44 $ 87 $ 87
After 1 but within 5 years 931 935 346 354
After 5 but within 10 years 1,362 1,387 2,898 2,932
After 10 years (2) 42,163 42,642 49,723 49,282
Total $ 44,500 $ 45,008 $ 53,054 $ 52,655
U.S. Treasury and federal agency securities
Due within 1 year $ 13,070 $ 13,084 $ 15,789 $ 15,853
After 1 but within 5 years 104,982 105,131 66,232 66,457
After 5 but within 10 years 2,286 2,325 2,129 2,185
After 10 years (2) 3,079 3,150 3,061 3,101
Total $123,417 $123,690 $ 87,211 $ 87,596
State and municipal
Due within 1 year $ 590 $ 590 $ 576 $ 581
After 1 but within 5 years 3,672 3,677 3,731 3,735
After 5 but within 10 years 532 546 439 482
After 10 years (2) 8,732 7,886 16,015 14,142
Total $ 13,526 $ 12,699 $ 20,761 $ 18,940
Foreign government
Due within 1 year $ 31,355 $ 31,382 $ 37,005 $ 36,959
After 1 but within 5 years 41,913 42,467 51,344 51,304
After 5 but within 10 years 16,008 15,779 7,314 7,216
After 10 years (2) 973 1,069 945 992
Total $ 90,249 $ 90,697 $ 96,608 $ 96,471
All other (3)
Due within 1 year $ 1,248 $ 1,251 $ 2,786 $ 2,733
After 1 but within 5 years 10,442 10,535 10,934 11,020
After 5 but within 10 years 7,282 7,318 5,632 5,641
After 10 years (2) 6,256 6,220 7,749 7,721
Total $ 25,228 $ 25,324 $ 27,101 $ 27,115
Total debt securities AFS $296,920 $297,418 $284,735 $282,777
(1) Includes mortgage-backed securities of U.S. government-sponsored agencies.
(2) Investments with no stated maturities are included as contractual maturities of greater than 10 years. Actual maturities may differ due to call or prepayment rights.
(3) Includes corporate, asset-backed and other debt securities.