Citibank 2014 Annual Report Download - page 194
Download and view the complete annual report
Please find page 194 of the 2014 Citibank annual report below. You can navigate through the pages in the report by either clicking on the pages listed below, or by using the keyword search tool below to find specific information within the annual report.-
 1
1 -
2
-
3
-
4
-
5
-
6
-
7
-
8
-
9
-
10
-
11
-
12
-
13
-
14
-
15
-
16
-
17
-
18
-
19
-
20
-
21
-
22
-
23
-
24
-
25
-
26
-
27
-
28
-
29
-
30
-
31
-
32
-
33
-
34
-
35
-
36
-
37
-
38
-
39
-
40
-
41
-
42
-
43
-
44
-
45
-
46
-
47
-
48
-
49
-
50
-
51
-
52
-
53
-
54
-
55
-
56
-
57
-
58
-
59
-
60
-
61
-
62
-
63
-
64
-
65
-
66
-
67
-
68
-
69
-
70
-
71
-
72
-
73
-
74
-
75
-
76
-
77
-
78
-
79
-
80
-
81
-
82
-
83
-
84
-
85
-
86
-
87
-
88
-
89
-
90
-
91
-
92
-
93
-
94
-
95
-
96
-
97
-
98
-
99
-
100
-
101
-
102
-
103
-
104
-
105
-
106
-
107
-
108
-
109
-
110
-
111
-
112
-
113
-
114
-
115
-
116
-
117
-
118
-
119
-
120
-
121
-
122
-
123
-
124
-
125
-
126
-
127
-
128
-
129
-
130
-
131
-
132
-
133
-
134
-
135
-
136
-
137
-
138
-
139
-
140
-
141
-
142
-
143
-
144
-
145
-
146
-
147
-
148
-
149
-
150
-
151
-
152
-
153
-
154
-
155
-
156
-
157
-
158
-
159
-
160
-
161
-
162
-
163
-
164
-
165
-
166
-
167
-
168
-
169
-
170
-
171
-
172
-
173
-
174
-
175
-
176
-
177
-
178
-
179
-
180
-
181
-
182
-
183
-
 184
184 -
 185
185 -
 186
186 -
 187
187 -
 188
188 -
 189
189 -
 190
190 -
 191
191 -
 192
192 -
 193
193 -
 194
194 -
 195
195 -
 196
196 -
 197
197 -
 198
198 -
 199
199 -
 200
200 -
 201
201 -
 202
202 -
 203
203 -
 204
204 -
205
-
206
-
207
-
208
-
209
-
210
-
211
-
212
-
213
-
214
-
215
-
216
-
217
-
218
-
219
-
220
-
221
-
222
-
223
-
224
-
225
-
226
-
227
-
228
-
229
-
230
-
231
-
232
-
233
-
234
-
235
-
236
-
237
-
238
-
239
-
240
-
241
-
242
-
243
-
244
-
245
-
246
-
247
-
248
-
249
-
250
-
251
-
252
-
253
-
254
-
255
-
256
-
257
-
258
-
259
-
260
-
261
-
262
-
263
-
264
-
265
-
266
-
267
-
268
-
269
-
270
-
271
-
272
-
273
-
274
-
275
-
276
-
277
-
278
-
279
-
280
-
281
-
282
-
283
-
284
-
285
-
286
-
287
-
288
-
289
-
290
-
291
-
292
-
293
-
294
-
295
-
296
-
297
-
298
-
299
-
300
-
301
-
302
-
303
-
304
-
305
-
306
-
307
-
308
-
309
-
310
-
311
-
312
-
313
-
314
-
315
-
316
-
317
-
318
-
319
-
320
-
321
-
322
-
323
-
324
-
325
-
326
-
327
 |
 |

177
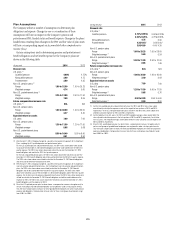
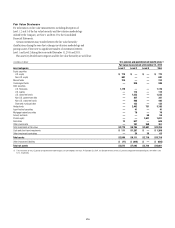
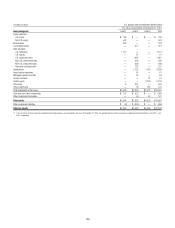
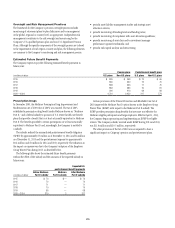
Level 3 Roll Forward
The reconciliations of the beginning and ending balances during the year for Level 3 assets are as follows:
In millions of dollars U.S. pension and postretirement benefit plans
Asset categories
Beginning Level 3
fair value at
Dec. 31, 2013
Realized
gains
(losses)
Unrealized
gains
(losses)
Purchases,
sales, and
issuances
Transfers in
and/or out of
Level 3
Ending Level 3
fair value at
Dec. 31, 2014
Hedge funds $1,126 $ 63 $ (25) $(264) $(169) $ 731
Annuity contracts 91 — (1) (31) — 59
Private equity 2,106 241 (187) (529) — 1,631
Other investments 150 (1) (5) 109 7 260
Total investments $3,473 $ 303 $(218) $ (715) $(162) $ 2,681
Other investment receivables 52 — — (17) — 35
Total assets $3,525 $ 303 $ (218) $(732) $ (162) $2,716
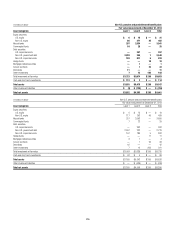
In millions of dollars U.S. pension and postretirement benefit plans
Asset categories
Beginning Level 3
fair value at
Dec. 31, 2012
Realized
gains
(losses)
Unrealized
gains
(losses)
Purchases,
sales, and
issuances
Transfers in
and/or out of
Level 3
Ending Level 3
fair value at
Dec. 31, 2013
Hedge funds $1,524 $ 45 $ 69 $ 19 $(531) $ 1,126
Annuity contracts 130 — (9) (33) 3 91
Private equity 2,419 264 (10) (564) (3) 2,106
Other investments 142 — 7 8 (7) 150
Total investments $4,215 $ 309 $ 57 $ (570) $ (538) $ 3,473
Other investment receivables 24 — — 28 — 52
Total assets $4,239 $ 309 $ 57 $(542) $(538) $ 3,525
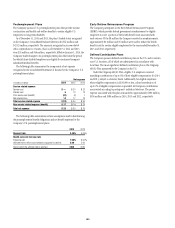
In millions of dollars Non-U.S. pension and postretirement benefit plans
Asset categories
Beginning Level 3
fair value at
Dec. 31, 2013
Unrealized
gains
(losses)
Purchases,
sales, and
issuances
Transfers in
and/or out of
Level 3
Ending Level 3
fair value at
Dec. 31, 2014
Equity securities
Non-U.S. equity $ 49 $ (3) $ — $ (1) $ 45
Debt securities
Non-U.S. government debt — — — 1 1
Non-U.S. corporate bonds 5 — 1 (1) 5
Hedge funds 11 (1) — — 10
Annuity contracts 32 — — — 32
Other investments 202 (1) (33) (5) 163
Total investments $ 299 $ (5) $(32) $ (6) $ 256
Cash and short-term investments — — — — —
Total assets $ 299 $ (5) $(32) $ (6) $ 256
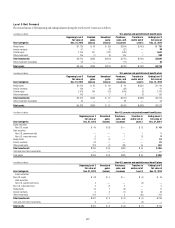
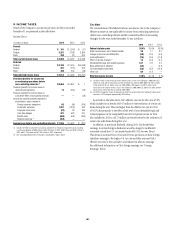
In millions of dollars Non-U.S. pension and postretirement benefit plans
Asset categories
Beginning Level 3
fair value at
Dec. 31, 2012
Unrealized
gains
(losses)
Purchases,
sales, and
issuances
Transfers in
and/or out of
Level 3
Ending Level 3
fair value at
Dec. 31, 2013
Equity securities
Non-U.S. equity $ 48 $ 5 $ — $ (4) $ 49
Debt securities
Non-U.S. government bonds 4 — — (4) —
Non-U.S. corporate bonds 4 (1) 2 — 5
Hedge funds 16 1 (6) — 11
Annuity contracts 6 3 (1) 24 32
Other investments 219 — 3 (20) 202
Total investments $297 $ 8 $ (2) $ (4) $ 299
Cash and short-term investments 3 — — (3) —
Total assets $ 300 $ 8 $ (2) $ (7) $ 299