Citibank 2014 Annual Report Download - page 122
Download and view the complete annual report
Please find page 122 of the 2014 Citibank annual report below. You can navigate through the pages in the report by either clicking on the pages listed below, or by using the keyword search tool below to find specific information within the annual report.-
 1
1 -
2
-
3
-
4
-
5
-
6
-
7
-
8
-
9
-
10
-
11
-
12
-
13
-
14
-
15
-
16
-
17
-
18
-
19
-
20
-
21
-
22
-
23
-
24
-
25
-
26
-
27
-
28
-
29
-
30
-
31
-
32
-
33
-
34
-
35
-
36
-
37
-
38
-
39
-
40
-
41
-
42
-
43
-
44
-
45
-
46
-
47
-
48
-
49
-
50
-
51
-
52
-
53
-
54
-
55
-
56
-
57
-
58
-
59
-
60
-
61
-
62
-
63
-
64
-
65
-
66
-
67
-
68
-
69
-
70
-
71
-
72
-
73
-
74
-
75
-
76
-
77
-
78
-
79
-
80
-
81
-
82
-
83
-
84
-
85
-
86
-
87
-
88
-
89
-
90
-
91
-
92
-
93
-
94
-
95
-
96
-
97
-
98
-
99
-
100
-
101
-
102
-
103
-
104
-
105
-
106
-
107
-
108
-
109
-
110
-
111
-
 112
112 -
 113
113 -
 114
114 -
 115
115 -
 116
116 -
 117
117 -
 118
118 -
 119
119 -
 120
120 -
 121
121 -
 122
122 -
 123
123 -
 124
124 -
 125
125 -
 126
126 -
 127
127 -
 128
128 -
 129
129 -
 130
130 -
 131
131 -
 132
132 -
133
-
134
-
135
-
136
-
137
-
138
-
139
-
140
-
141
-
142
-
143
-
144
-
145
-
146
-
147
-
148
-
149
-
150
-
151
-
152
-
153
-
154
-
155
-
156
-
157
-
158
-
159
-
160
-
161
-
162
-
163
-
164
-
165
-
166
-
167
-
168
-
169
-
170
-
171
-
172
-
173
-
174
-
175
-
176
-
177
-
178
-
179
-
180
-
181
-
182
-
183
-
184
-
185
-
186
-
187
-
188
-
189
-
190
-
191
-
192
-
193
-
194
-
195
-
196
-
197
-
198
-
199
-
200
-
201
-
202
-
203
-
204
-
205
-
206
-
207
-
208
-
209
-
210
-
211
-
212
-
213
-
214
-
215
-
216
-
217
-
218
-
219
-
220
-
221
-
222
-
223
-
224
-
225
-
226
-
227
-
228
-
229
-
230
-
231
-
232
-
233
-
234
-
235
-
236
-
237
-
238
-
239
-
240
-
241
-
242
-
243
-
244
-
245
-
246
-
247
-
248
-
249
-
250
-
251
-
252
-
253
-
254
-
255
-
256
-
257
-
258
-
259
-
260
-
261
-
262
-
263
-
264
-
265
-
266
-
267
-
268
-
269
-
270
-
271
-
272
-
273
-
274
-
275
-
276
-
277
-
278
-
279
-
280
-
281
-
282
-
283
-
284
-
285
-
286
-
287
-
288
-
289
-
290
-
291
-
292
-
293
-
294
-
295
-
296
-
297
-
298
-
299
-
300
-
301
-
302
-
303
-
304
-
305
-
306
-
307
-
308
-
309
-
310
-
311
-
312
-
313
-
314
-
315
-
316
-
317
-
318
-
319
-
320
-
321
-
322
-
323
-
324
-
325
-
326
-
327
 |
 |

105
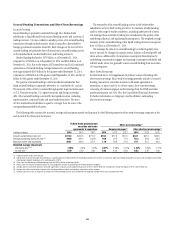
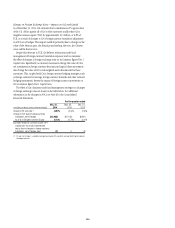
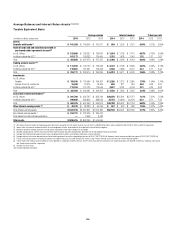
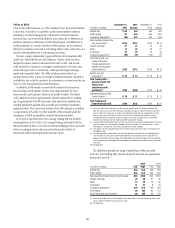
Interest Revenue/Expense and Yields
Average Rates
-
Interest Revenue, Interest Expense, and Net Interest Margin
Interest Revenue-Average Rate
Interest Expense-Average Rate
Net Interest Margin
0.95%
0.98%
1.07%
1.08%
1.09%
1.16%
1.21%
1.29%
1.36%
1.43%
1.52%
1.58%
2.84%
4.18% 4.03% 4.01% 4.00% 3.94% 3.85% 3.77% 3.77% 3.77% 3.73% 3.70% 3.68%
2.75% 2.81% 2.88% 2.88% 2.85% 2.81% 2.88% 2.90% 2.87% 2.91% 2.92%
1Q12 2Q12
2012: 2.82% 2013: 2.85% 2014: 2.90%
3Q12 4Q12 1Q13 2Q13 3Q13 4Q13 1Q14 2Q14 3Q14 4Q14
0.50%
1.00%
1.50%
2.00%
2.50%
3.00%
3.50%
4.00%
4.50%
In millions of dollars, except as otherwise noted 2014 2013 2012
Change
2014 vs. 2013
Change
2013 vs. 2012
Interest revenue (1) $62,180 $63,491 $67,840 (2)% (6)%
Interest expense 13,690 16,177 20,612 (15) (22)
Net interest revenue (1)(2)(3) $48,490 $47,314 $47,228 2% —%
Interest revenue—average rate 3.72% 3.83% 4.06% (11)bps (23)bps
Interest expense—average rate 1.02 1.19 1.47 (17)bps (28)bps
Net interest margin 2.90% 2.85% 2.82% 5bps 3bps
Interest-rate benchmarks
Two-year U.S. Treasury note—average rate 0.46% 0.31% 0.28% 15bps 3bps
10-year U.S. Treasury note—average rate 2.54 2.35 1.80 19bps 55bps
10-year vs. two-year spread 208bps 204bps 152bps
(1) Net interest revenue includes the taxable equivalent adjustments (based on the U.S. federal statutory tax rate of 35%) of $498 million, $521 million and $542 million for 2014, 2013 and 2012, respectively.
(2) Excludes expenses associated with certain hybrid financial instruments, which are classified as Long-term debt and accounted for at fair value with changes recorded in Principal transactions.
(3) Interest revenue, expense, rates and volumes exclude Credicard (Discontinued operations) for all periods presented. See Note 2 to the Consolidated Financial Statements.
Citi’s net interest margin (NIM) is calculated by dividing gross interest
revenue less gross interest expense by average interest earning assets. Citi’s
NIM improved to 290 basis points in 2014, up from 285 basis points in 2013,
primarily reflecting lower cost of funds, including continued declines in the
cost of deposits and long-term debt (see “Funding and Liquidity” above),
partially offset by continued lower loan yields.
Going into 2015, while Citi currently expects its NIM to remain relatively
stable to full-year 2014 levels, the continued run-off and sales of assets from
Citi Holdings could impact NIM quarter-to-quarter.