Citibank 2014 Annual Report Download - page 41
Download and view the complete annual report
Please find page 41 of the 2014 Citibank annual report below. You can navigate through the pages in the report by either clicking on the pages listed below, or by using the keyword search tool below to find specific information within the annual report.-
 1
1 -
2
-
3
-
4
-
5
-
6
-
7
-
8
-
9
-
10
-
11
-
12
-
13
-
14
-
15
-
16
-
17
-
18
-
19
-
20
-
21
-
22
-
23
-
24
-
25
-
26
-
27
-
28
-
29
-
30
-
 31
31 -
 32
32 -
 33
33 -
 34
34 -
 35
35 -
 36
36 -
 37
37 -
 38
38 -
 39
39 -
 40
40 -
 41
41 -
 42
42 -
 43
43 -
 44
44 -
 45
45 -
 46
46 -
 47
47 -
 48
48 -
 49
49 -
 50
50 -
 51
51 -
52
-
53
-
54
-
55
-
56
-
57
-
58
-
59
-
60
-
61
-
62
-
63
-
64
-
65
-
66
-
67
-
68
-
69
-
70
-
71
-
72
-
73
-
74
-
75
-
76
-
77
-
78
-
79
-
80
-
81
-
82
-
83
-
84
-
85
-
86
-
87
-
88
-
89
-
90
-
91
-
92
-
93
-
94
-
95
-
96
-
97
-
98
-
99
-
100
-
101
-
102
-
103
-
104
-
105
-
106
-
107
-
108
-
109
-
110
-
111
-
112
-
113
-
114
-
115
-
116
-
117
-
118
-
119
-
120
-
121
-
122
-
123
-
124
-
125
-
126
-
127
-
128
-
129
-
130
-
131
-
132
-
133
-
134
-
135
-
136
-
137
-
138
-
139
-
140
-
141
-
142
-
143
-
144
-
145
-
146
-
147
-
148
-
149
-
150
-
151
-
152
-
153
-
154
-
155
-
156
-
157
-
158
-
159
-
160
-
161
-
162
-
163
-
164
-
165
-
166
-
167
-
168
-
169
-
170
-
171
-
172
-
173
-
174
-
175
-
176
-
177
-
178
-
179
-
180
-
181
-
182
-
183
-
184
-
185
-
186
-
187
-
188
-
189
-
190
-
191
-
192
-
193
-
194
-
195
-
196
-
197
-
198
-
199
-
200
-
201
-
202
-
203
-
204
-
205
-
206
-
207
-
208
-
209
-
210
-
211
-
212
-
213
-
214
-
215
-
216
-
217
-
218
-
219
-
220
-
221
-
222
-
223
-
224
-
225
-
226
-
227
-
228
-
229
-
230
-
231
-
232
-
233
-
234
-
235
-
236
-
237
-
238
-
239
-
240
-
241
-
242
-
243
-
244
-
245
-
246
-
247
-
248
-
249
-
250
-
251
-
252
-
253
-
254
-
255
-
256
-
257
-
258
-
259
-
260
-
261
-
262
-
263
-
264
-
265
-
266
-
267
-
268
-
269
-
270
-
271
-
272
-
273
-
274
-
275
-
276
-
277
-
278
-
279
-
280
-
281
-
282
-
283
-
284
-
285
-
286
-
287
-
288
-
289
-
290
-
291
-
292
-
293
-
294
-
295
-
296
-
297
-
298
-
299
-
300
-
301
-
302
-
303
-
304
-
305
-
306
-
307
-
308
-
309
-
310
-
311
-
312
-
313
-
314
-
315
-
316
-
317
-
318
-
319
-
320
-
321
-
322
-
323
-
324
-
325
-
326
-
327
 |
 |

24
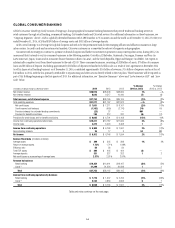
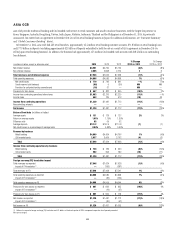
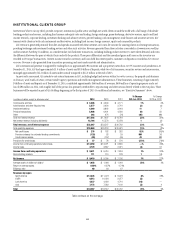
INSTITUTIONAL CLIENTS GROUP
Institutional Clients Group (ICG) provides corporate, institutional, public sector and high-net-worth clients around the world with a full range of wholesale
banking products and services, including fixed income and equity sales and trading, foreign exchange, prime brokerage, derivative services, equity and fixed
income research, corporate lending, investment banking and advisory services, private banking, cash management, trade finance and securities services. ICG
transacts with clients in both cash instruments and derivatives, including fixed income, foreign currency, equity and commodity products.
ICG revenue is generated primarily from fees and spreads associated with these activities. ICG earns fee income for assisting clients in clearing transactions,
providing brokerage and investment banking services and other such activities. Revenue generated from these activities is recorded in Commissions and fees
and Investment banking. In addition, as a market maker, ICG facilitates transactions, including holding product inventory to meet client demand, and earns
the differential between the price at which it buys and sells the products. These price differentials and the unrealized gains and losses on the inventory are
recorded in Principal transactions. Interest income earned on inventory and loans held less interest paid to customers on deposits is recorded as Net interest
revenue. Revenue is also generated from transaction processing and assets under custody and administration.
ICG’s international presence is supported by trading floors in approximately 80 countries and a proprietary network in over 95 countries and jurisdictions. At
December 31, 2014, ICG had approximately $1.0 trillion of assets and $559 billion of deposits, while two of its businesses, securities services and issuer services,
managed approximately $16.2 trillion of assets under custody compared to $14.3 trillion at the end of 2013.
As previously announced, Citi intends to exit certain businesses in ICG, including hedge fund services within Securities services, the prepaid cards business
in Treasury and trade solutions, certain transfer agency operations and wealth management administration. These businesses, consisting of approximately
$4 billion of assets and deposits as of December 31, 2014, contributed approximately $460 million of revenues, $600 million of operating expenses and a net
loss of $80 million in 2014, with roughly half of the pre-tax loss primarily attributable to repositioning and other actions directly related to the exit plans. These
businesses will be reported as part of Citi Holdings beginning in the first quarter of 2015. For additional information, see “Executive Summary” above.
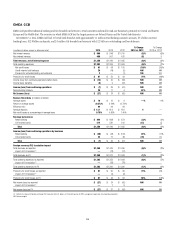
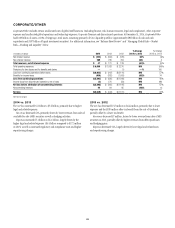
In millions of dollars, except as otherwise noted 2014 2013 2012
% Change
2014 vs. 2013
% Change
2013 vs. 2012
Commissions and fees $ 4,386 $ 4,344 $ 4,171 1% 4%
Administration and other fiduciary fees 2,577 2,626 2,741 (2) (4)
Investment banking 4,269 3,862 3,618 11 7
Principal transactions 5,908 6,491 4,330 (9) 50
Other 363 674 (76) (46) NM
Total non-interest revenue $ 17,503 $ 17,997 $ 14,784 (3)% 22%
Net interest revenue (including dividends) 15,764 15,570 15,978 1(3)
Total revenues, net of interest expense $ 33,267 $ 33,567 $ 30,762 (1)% 9%
Total operating expenses $ 19,960 $ 20,218 $ 20,631 (1)% (2)%
Net credit losses $ 276 $ 182 $ 282 52% (35)%
Provision (release) for unfunded lending commitments (129) 53 39 NM 36
Credit reserve release (90) (157) (45) 43 NM
Provisions for credit losses $ 57 $ 78 $ 276 (27)% (72)%
Income from continuing operations before taxes $ 13,250 $ 13,271 $ 9,855 —% 35%
Income taxes 3,729 3,857 2,021 (3) 91
Income from continuing operations $ 9,521 $ 9,414 $ 7,834 1% 20%
Noncontrolling interests 111 110 128 1(14)
Net income $ 9,410 $ 9,304 $ 7,706 1% 21%
Average assets (in billions of dollars) $ 1,058 $ 1,066 $ 1,044 (1)% 2%
Return on average assets 0.89% 0.87% 0.74%
Efficiency ratio 60 60 67
Revenues by region
North America $ 12,345 $ 11,473 $ 8,973 8% 28%
EMEA 9,513 10,020 9,977 (5) —
Latin America 4,237 4,692 4,710 (10) —
Asia 7,172 7,382 7,102 (3) 4
Total $ 33,267 $ 33,567 $ 30,762 (1)% 9%
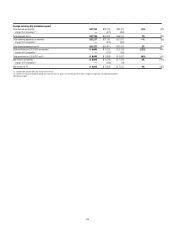
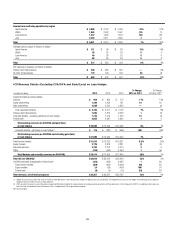
Table continues on the next page.