Citibank 2014 Annual Report Download - page 31
Download and view the complete annual report
Please find page 31 of the 2014 Citibank annual report below. You can navigate through the pages in the report by either clicking on the pages listed below, or by using the keyword search tool below to find specific information within the annual report.-
 1
1 -
2
-
3
-
4
-
5
-
6
-
7
-
8
-
9
-
10
-
11
-
12
-
13
-
14
-
15
-
16
-
17
-
18
-
19
-
20
-
 21
21 -
 22
22 -
 23
23 -
 24
24 -
 25
25 -
 26
26 -
 27
27 -
 28
28 -
 29
29 -
 30
30 -
 31
31 -
 32
32 -
 33
33 -
 34
34 -
 35
35 -
 36
36 -
 37
37 -
 38
38 -
 39
39 -
 40
40 -
 41
41 -
42
-
43
-
44
-
45
-
46
-
47
-
48
-
49
-
50
-
51
-
52
-
53
-
54
-
55
-
56
-
57
-
58
-
59
-
60
-
61
-
62
-
63
-
64
-
65
-
66
-
67
-
68
-
69
-
70
-
71
-
72
-
73
-
74
-
75
-
76
-
77
-
78
-
79
-
80
-
81
-
82
-
83
-
84
-
85
-
86
-
87
-
88
-
89
-
90
-
91
-
92
-
93
-
94
-
95
-
96
-
97
-
98
-
99
-
100
-
101
-
102
-
103
-
104
-
105
-
106
-
107
-
108
-
109
-
110
-
111
-
112
-
113
-
114
-
115
-
116
-
117
-
118
-
119
-
120
-
121
-
122
-
123
-
124
-
125
-
126
-
127
-
128
-
129
-
130
-
131
-
132
-
133
-
134
-
135
-
136
-
137
-
138
-
139
-
140
-
141
-
142
-
143
-
144
-
145
-
146
-
147
-
148
-
149
-
150
-
151
-
152
-
153
-
154
-
155
-
156
-
157
-
158
-
159
-
160
-
161
-
162
-
163
-
164
-
165
-
166
-
167
-
168
-
169
-
170
-
171
-
172
-
173
-
174
-
175
-
176
-
177
-
178
-
179
-
180
-
181
-
182
-
183
-
184
-
185
-
186
-
187
-
188
-
189
-
190
-
191
-
192
-
193
-
194
-
195
-
196
-
197
-
198
-
199
-
200
-
201
-
202
-
203
-
204
-
205
-
206
-
207
-
208
-
209
-
210
-
211
-
212
-
213
-
214
-
215
-
216
-
217
-
218
-
219
-
220
-
221
-
222
-
223
-
224
-
225
-
226
-
227
-
228
-
229
-
230
-
231
-
232
-
233
-
234
-
235
-
236
-
237
-
238
-
239
-
240
-
241
-
242
-
243
-
244
-
245
-
246
-
247
-
248
-
249
-
250
-
251
-
252
-
253
-
254
-
255
-
256
-
257
-
258
-
259
-
260
-
261
-
262
-
263
-
264
-
265
-
266
-
267
-
268
-
269
-
270
-
271
-
272
-
273
-
274
-
275
-
276
-
277
-
278
-
279
-
280
-
281
-
282
-
283
-
284
-
285
-
286
-
287
-
288
-
289
-
290
-
291
-
292
-
293
-
294
-
295
-
296
-
297
-
298
-
299
-
300
-
301
-
302
-
303
-
304
-
305
-
306
-
307
-
308
-
309
-
310
-
311
-
312
-
313
-
314
-
315
-
316
-
317
-
318
-
319
-
320
-
321
-
322
-
323
-
324
-
325
-
326
-
327
 |
 |

14
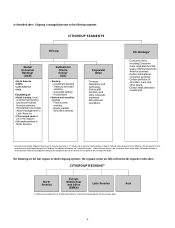
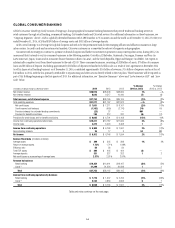
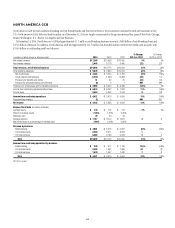
GLOBAL CONSUMER BANKING
Global Consumer Banking (GCB) consists of Citigroup’s four geographical consumer banking businesses that provide traditional banking services to
retail customers through retail banking, commercial banking, Citi-branded cards and Citi retail services (for additional information on these businesses, see
“Citigroup Segments” above). GCB is a globally diversified business with 3,280 branches in 35 countries around the world as of December 31, 2014. For the year
ended December 31, 2014, GCB had $399 billion of average assets and $331 billion of average deposits.
GCB’s overall strategy is to leverage Citi’s global footprint and seek to be the preeminent bank for the emerging affluent and affluent consumers in large
urban centers. In credit cards and in certain retail markets, Citi serves customers in a somewhat broader set of segments and geographies.
Consistent with its strategy to continue to optimize its branch footprint and further concentrate its presence in major metropolitan areas, during 2014, Citi
announced that it intends to exit its consumer businesses in the following markets: Costa Rica, El Salvador, Guatemala, Nicaragua, Panama and Peru (in
Latin America); Japan, Guam and its consumer finance business in Korea (in Asia); and the Czech Republic, Egypt and Hungary (in EMEA). Citi expects to
substantially complete its exit from these businesses by the end of 2015. These consumer businesses, consisting of $28 billion of assets, $7 billion of consumer
loans and $3 billion of deposits (excluding approximately $21 billion of deposits reclassified to held-for-sale as a result of Citi’s agreement in December 2014
to sell its Japan retail banking business) as of December 31, 2014, contributed approximately $1.6 billion of revenues, $1.4 billion of expenses and a net loss of
$40 million in 2014, with the loss primarily attributable to repositioning and other actions directly related to the exit plans. These businesses will be reported as
part of Citi Holdings beginning in the first quarter of 2015. For additional information, see “Executive Summary” above and “Latin America GCB” and “Asia
GCB” below.
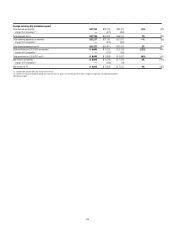
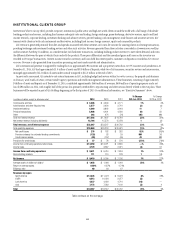
In millions of dollars except as otherwise noted 2014 2013 2012
% Change
2014 vs. 2013
% Change
2013 vs. 2012
Net interest revenue $28,910 $28,648 $28,665 1% —%
Non-interest revenue 8,843 9,517 10,440 (7) (9)
Total revenues, net of interest expense $37,753 $38,165 $39,105 (1)% (2)%
Total operating expenses $21,277 $21,187 $21,872 —% (3)%
Net credit losses $ 7,051 $ 7,211 $ 8,107 (2)% (11)%
Credit reserve build (release) (1,162) (669) (2,176) (74) 69
Provision (release) for unfunded lending commitments (23) 37 — NM —
Provision for benefits and claims 199 212 237 (6) (11)
Provisions for credit losses and for benefits and claims $ 6,065 $ 6,791 $ 6,168 (11)% 10%
Income from continuing operations before taxes $10,411 $10,187 $11,065 2% (8)%
Income taxes 3,473 3,424 3,468 1(1)
Income from continuing operations $ 6,938 $ 6,763 $ 7,597 3% (11)%
Noncontrolling interests 26 17 3 53 NM
Net income $ 6,912 $ 6,746 $ 7,594 2% (11)%
Balance Sheet data (in billions of dollars)
Average assets $ 399 $ 395 $ 388 1% 2%
Return on average assets 1.73% 1.71% 1.98%
Efficiency ratio 56 56 56
Total EOP assets $ 396 $ 405 $ 404 (2) —
Average deposits 331 327 322 12
Net credit losses as a percentage of average loans 2.37% 2.51% 2.87%
Revenue by business
Retail banking $16,354 $16,941 $18,167 (3)% (7)%
Cards (1) 21,399 21,224 20,938 11
Total $37,753 $38,165 $39,105 (1)% (2)%
Income from continuing operations by business
Retail banking $ 1,776 $ 1,907 $ 2,794 (7)% (32)%
Cards (1) 5,162 4,856 4,803 61
Total $ 6,938 $ 6,763 $ 7,597 3% (11)%
Table and notes continue on the next page.