Citibank 2014 Annual Report Download - page 36
Download and view the complete annual report
Please find page 36 of the 2014 Citibank annual report below. You can navigate through the pages in the report by either clicking on the pages listed below, or by using the keyword search tool below to find specific information within the annual report.-
 1
1 -
2
-
3
-
4
-
5
-
6
-
7
-
8
-
9
-
10
-
11
-
12
-
13
-
14
-
15
-
16
-
17
-
18
-
19
-
20
-
21
-
22
-
23
-
24
-
25
-
 26
26 -
 27
27 -
 28
28 -
 29
29 -
 30
30 -
 31
31 -
 32
32 -
 33
33 -
 34
34 -
 35
35 -
 36
36 -
 37
37 -
 38
38 -
 39
39 -
 40
40 -
 41
41 -
 42
42 -
 43
43 -
 44
44 -
 45
45 -
 46
46 -
47
-
48
-
49
-
50
-
51
-
52
-
53
-
54
-
55
-
56
-
57
-
58
-
59
-
60
-
61
-
62
-
63
-
64
-
65
-
66
-
67
-
68
-
69
-
70
-
71
-
72
-
73
-
74
-
75
-
76
-
77
-
78
-
79
-
80
-
81
-
82
-
83
-
84
-
85
-
86
-
87
-
88
-
89
-
90
-
91
-
92
-
93
-
94
-
95
-
96
-
97
-
98
-
99
-
100
-
101
-
102
-
103
-
104
-
105
-
106
-
107
-
108
-
109
-
110
-
111
-
112
-
113
-
114
-
115
-
116
-
117
-
118
-
119
-
120
-
121
-
122
-
123
-
124
-
125
-
126
-
127
-
128
-
129
-
130
-
131
-
132
-
133
-
134
-
135
-
136
-
137
-
138
-
139
-
140
-
141
-
142
-
143
-
144
-
145
-
146
-
147
-
148
-
149
-
150
-
151
-
152
-
153
-
154
-
155
-
156
-
157
-
158
-
159
-
160
-
161
-
162
-
163
-
164
-
165
-
166
-
167
-
168
-
169
-
170
-
171
-
172
-
173
-
174
-
175
-
176
-
177
-
178
-
179
-
180
-
181
-
182
-
183
-
184
-
185
-
186
-
187
-
188
-
189
-
190
-
191
-
192
-
193
-
194
-
195
-
196
-
197
-
198
-
199
-
200
-
201
-
202
-
203
-
204
-
205
-
206
-
207
-
208
-
209
-
210
-
211
-
212
-
213
-
214
-
215
-
216
-
217
-
218
-
219
-
220
-
221
-
222
-
223
-
224
-
225
-
226
-
227
-
228
-
229
-
230
-
231
-
232
-
233
-
234
-
235
-
236
-
237
-
238
-
239
-
240
-
241
-
242
-
243
-
244
-
245
-
246
-
247
-
248
-
249
-
250
-
251
-
252
-
253
-
254
-
255
-
256
-
257
-
258
-
259
-
260
-
261
-
262
-
263
-
264
-
265
-
266
-
267
-
268
-
269
-
270
-
271
-
272
-
273
-
274
-
275
-
276
-
277
-
278
-
279
-
280
-
281
-
282
-
283
-
284
-
285
-
286
-
287
-
288
-
289
-
290
-
291
-
292
-
293
-
294
-
295
-
296
-
297
-
298
-
299
-
300
-
301
-
302
-
303
-
304
-
305
-
306
-
307
-
308
-
309
-
310
-
311
-
312
-
313
-
314
-
315
-
316
-
317
-
318
-
319
-
320
-
321
-
322
-
323
-
324
-
325
-
326
-
327
 |
 |
19
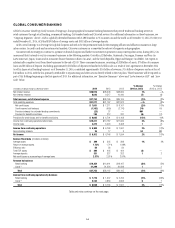
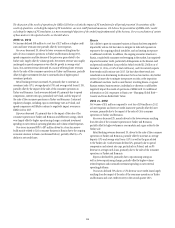
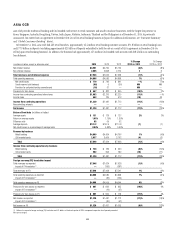
The discussion of the results of operations for EMEA GCB below excludes the impact of FX translation for all periods presented. Presentations of the
results of operations, excluding the impact of FX translation, are non-GAAP financial measures. Citi believes the presentation of EMEA GCB’s results
excluding the impact of FX translation is a more meaningful depiction of the underlying fundamentals of the business. For a reconciliation of certain
of these metrics to the reported results, see the table above.
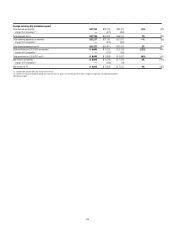
2014 vs. 2013
Net income declined $58 million to a net loss of $27 million as higher credit
costs and lower revenues were partially offset by lower expenses.
Revenues decreased 1%, driven by lower revenues resulting from the
sales of Citi’s consumer operations in Turkey and Romania during 2013,
spread compression and the absence of the prior-year gain related to the
Turkey sale, largely offset by volume growth. Net interest revenue was roughly
unchanged as spread compression was offset by growth in average retail
loans. Non-interest revenue decreased 4%, mainly reflecting lower revenues
due to the sales of the consumer operations in Turkey and Romania, partially
offset by higher investment fees due to increased sales of higher spread
investment products.
Retail banking revenues increased 2%, primarily due to increases in
investment sales (3%), average deposits (5%) and average retail loans (11%),
partially offset by the impact of the sales of the consumer operations in
Turkey and Romania. Cards revenues declined 6%, primarily due to spread
compression, interest rate caps, particularly in Poland, and the impact of
the sales of the consumer operations in Turkey and Romania. Continued
regulatory changes, including caps on interchange rates in Poland, and
spread compression will likely continue to negatively impact revenues in
EMEA GCB in 2015.
Expenses decreased 1%, primarily due to the impact of the sales of the
consumer operations in Turkey and Romania and efficiency savings, which
were largely offset by higher repositioning charges, continued investment
spending on new internal operating platforms and volume-related expenses.
Provisions increased 98% to $87 million driven by a loan loss reserve
build mainly related to Citi’s consumer business in Russia due to the ongoing
economic situation in Russia (as discussed below), partially offset by a 1%
decline in net credit losses.
Russia
Citi’s ability to grow its consumer business in Russia has been negatively
impacted by actions Citi has taken to mitigate its risks and exposures in
response to the ongoing political instability, such as limiting its exposure
to additional credit risk. In addition, the ongoing economic situation in
Russia, coupled with consumer overleveraging in the market, has negatively
impacted consumer credit, particularly delinquencies in the Russian card
and personal installment loan portfolios (which totaled $1.2 billion as of
December 31, 2014, or 0.4% of total GCB loans), and Citi currently expects
these trends could continue into 2015. Citi has taken these trends into
consideration in determining its allowance for loan loss reserves. Any further
actions Citi may take to mitigate its exposures or risks, or the imposition
of additional sanctions (such as asset freezes) involving Russia or against
Russian entities, business sectors, individuals or otherwise, could further
negatively impact the results of operations of EMEA GCB. For additional
information on Citi’s exposures in Russia, see “Managing Global Risk—
Country and Cross-Border Risk” below.
2013 vs. 2012
Net income of $31 million compared to a net loss of $56 million in 2012
as lower expenses and lower net credit losses were partially offset by lower
revenues, primarily due to the impact of the sales of Citi’s consumer
operations in Turkey and Romania.
Revenues decreased 2%, mainly driven by the lower revenues resulting
from the sales of the consumer operations in Turkey and Romania,
partially offset by higher volumes in core markets and a gain related to the
Turkey sale.
Retail banking revenues decreased 1%, driven by the sales of the consumer
operations in Turkey and Romania, partially offset by increases in average
deposits (1%) and average retail loans (13%) as well as the gain related
to the Turkey sale. Cards revenues declined 4%, primarily due to spread
compression and interest rate caps, particularly in Poland, and an 8%
decrease in average cards loans, primarily due to the sales of the consumer
operations in Turkey and Romania.
Expenses declined 6%, primarily due to repositioning savings as
well as lower repositioning charges, partially offset by higher volume-
related expenses and continued investment spending on new internal
operating platforms.
Provisions declined 53% due to a 37% decrease in net credit losses largely
resulting from the impact of the sales of the consumer operations in Turkey
and Romania and a net credit recovery in the second quarter 2013.