Citibank 2014 Annual Report Download - page 187
Download and view the complete annual report
Please find page 187 of the 2014 Citibank annual report below. You can navigate through the pages in the report by either clicking on the pages listed below, or by using the keyword search tool below to find specific information within the annual report.-
 1
1 -
2
-
3
-
4
-
5
-
6
-
7
-
8
-
9
-
10
-
11
-
12
-
13
-
14
-
15
-
16
-
17
-
18
-
19
-
20
-
21
-
22
-
23
-
24
-
25
-
26
-
27
-
28
-
29
-
30
-
31
-
32
-
33
-
34
-
35
-
36
-
37
-
38
-
39
-
40
-
41
-
42
-
43
-
44
-
45
-
46
-
47
-
48
-
49
-
50
-
51
-
52
-
53
-
54
-
55
-
56
-
57
-
58
-
59
-
60
-
61
-
62
-
63
-
64
-
65
-
66
-
67
-
68
-
69
-
70
-
71
-
72
-
73
-
74
-
75
-
76
-
77
-
78
-
79
-
80
-
81
-
82
-
83
-
84
-
85
-
86
-
87
-
88
-
89
-
90
-
91
-
92
-
93
-
94
-
95
-
96
-
97
-
98
-
99
-
100
-
101
-
102
-
103
-
104
-
105
-
106
-
107
-
108
-
109
-
110
-
111
-
112
-
113
-
114
-
115
-
116
-
117
-
118
-
119
-
120
-
121
-
122
-
123
-
124
-
125
-
126
-
127
-
128
-
129
-
130
-
131
-
132
-
133
-
134
-
135
-
136
-
137
-
138
-
139
-
140
-
141
-
142
-
143
-
144
-
145
-
146
-
147
-
148
-
149
-
150
-
151
-
152
-
153
-
154
-
155
-
156
-
157
-
158
-
159
-
160
-
161
-
162
-
163
-
164
-
165
-
166
-
167
-
168
-
169
-
170
-
171
-
172
-
173
-
174
-
175
-
176
-
 177
177 -
 178
178 -
 179
179 -
 180
180 -
 181
181 -
 182
182 -
 183
183 -
 184
184 -
 185
185 -
 186
186 -
 187
187 -
 188
188 -
 189
189 -
 190
190 -
 191
191 -
 192
192 -
 193
193 -
 194
194 -
 195
195 -
 196
196 -
 197
197 -
198
-
199
-
200
-
201
-
202
-
203
-
204
-
205
-
206
-
207
-
208
-
209
-
210
-
211
-
212
-
213
-
214
-
215
-
216
-
217
-
218
-
219
-
220
-
221
-
222
-
223
-
224
-
225
-
226
-
227
-
228
-
229
-
230
-
231
-
232
-
233
-
234
-
235
-
236
-
237
-
238
-
239
-
240
-
241
-
242
-
243
-
244
-
245
-
246
-
247
-
248
-
249
-
250
-
251
-
252
-
253
-
254
-
255
-
256
-
257
-
258
-
259
-
260
-
261
-
262
-
263
-
264
-
265
-
266
-
267
-
268
-
269
-
270
-
271
-
272
-
273
-
274
-
275
-
276
-
277
-
278
-
279
-
280
-
281
-
282
-
283
-
284
-
285
-
286
-
287
-
288
-
289
-
290
-
291
-
292
-
293
-
294
-
295
-
296
-
297
-
298
-
299
-
300
-
301
-
302
-
303
-
304
-
305
-
306
-
307
-
308
-
309
-
310
-
311
-
312
-
313
-
314
-
315
-
316
-
317
-
318
-
319
-
320
-
321
-
322
-
323
-
324
-
325
-
326
-
327
 |
 |

170
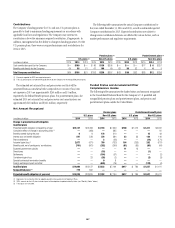
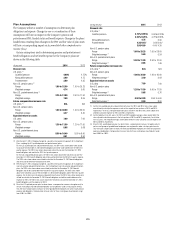
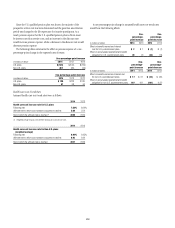
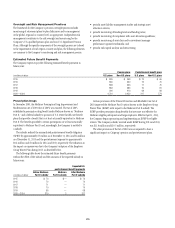
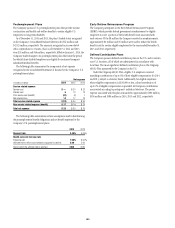
Plan Assumptions
The Company utilizes a number of assumptions to determine plan
obligations and expense. Changes in one or a combination of these
assumptions will have an impact on the Company’s pension and
postretirement PBO, funded status and benefit expense. Changes in the plans’
funded status resulting from changes in the PBO and fair value of plan assets
will have a corresponding impact on Accumulated other comprehensive
income (loss).
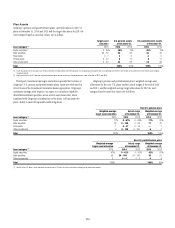
Certain assumptions used in determining pension and postretirement
benefit obligations and net benefit expense for the Company’s plans are
shown in the following table:
At year end 2014 2013
Discount rate
U.S. plans (1)
Qualified pension 4.00% 4.75%
Nonqualified pension 3.90 4.75
Postretirement 3.80 4.35
Non-U.S. pension plans (2)
Range 1.00 to 32.50 1.60 to 29.25
Weighted average 4.74 5.60
Non-U.S. postretirement plans (2)
Range 2.25 to 12.00 3.50 to 11.90
Weighted average 7.50 8.65
Future compensation increase rate
U.S. plans (3) N/A N/A
Non-U.S. pension plans
Range 1.00 to 30.00 1.00 to 26.00
Weighted average 3.27 3.40
Expected return on assets
U.S. plans 7.00 7.00
Non-U.S. pension plans
Range 1.30 to 11.50 1.20 to 11.50
Weighted average 5.08 5.68
Non-U.S. postretirement plans
Range 8.50 to 10.40 8.50 to 8.90
Weighted average 8.51 8.50
(1) Effective April 1, 2013, Citigroup changed to a quarterly remeasurement approach for its Significant
Plans, including the U.S. qualified pension and postretirement plans.
For the U.S. qualified pension and postretirement plans, the 2014 rates shown above were utilized
to calculate the December 31, 2014 benefit obligation and will be used to determine the 2015 first
quarter expense. The 2013 rates shown above were utilized to calculate the December 31, 2013
benefit obligation and used for the 2014 first quarter expense.
For the U.S. nonqualified pension plans, the 2014 rates shown above were utilized to calculate the
December 31, 2014 benefit obligation and will be used to determine the 2015 first quarter expense.
The 2013 rates shown above were utilized to calculate the December 31, 2013 benefit obligations
and were used to determine the expense for 2014.
(2) Effective April 1, 2013, Citigroup changed to a quarterly remeasurement approach for its Significant
non-U.S. pension and postretirement plans. For the Significant non-U.S. pension and postretirement
plans, the 2014 rates shown above were utilized to calculate the December 31, 2014 benefit
obligation and will be used to determine the 2015 first quarter expense. The 2013 rates shown
above were utilized to calculate the December 31, 2013 benefit obligation and the 2014 first quarter
expense. For all other non-U.S. pension and postretirement plans, the 2014 rates shown above were
utilized to calculate the December 31, 2014 benefit obligations and will be used to determine the
expense for 2015. The 2013 rates shown above were utilized to calculate the December 31, 2013
benefit obligations and the expense for 2014.
(3) Since the U.S. qualified pension plan has been frozen, a compensation increase rate applies only to
certain small groups of grandfathered employees accruing benefits under a final pay plan formula.
Only the future compensation increases for these grandfathered employees will affect future pension
expense and obligations. Compensation increase rates for these small groups of participants range
from 3.00% to 4.00%.
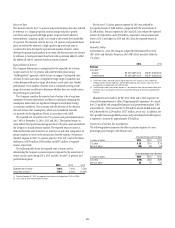
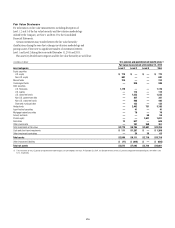
During the year 2014 2013
Discount rate
U.S. plans (1)
Qualified pension 4.75%/4.55
4.25%/4.25
%/
%
3.90%/4.20
4.75%/4.80
%/
%
Nonqualified pension 4.75 3.90
Postretirement 4.35/4.15
3.95/4.00
/3.60/3.60
4.40/ 4.30
/
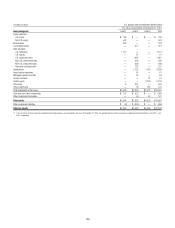
Non-U.S. pension plans
Range 1.60 to 29.25 1.50 to 28.00
Weighted average (2) 5.60 5.24
Non-U.S. postretirement plans
Range 3.50 to 11.90 3.50 to 10.00
Weighted average (2) 8.65 7.46
Future compensation increase rate
U.S. plans (3) N/A N/A
Non-U.S. pension plans
Range 1.00 to 26.00 1.20 to 26.00
Weighted average (2) 3.40 3.93
Expected return on assets
U.S. plans 7.00 7.00
Non-U.S. pension plans
Range 1.20 to 11.50 0.90 to 11.50
Weighted average (2) 5.68 5.76
Non-U.S. postretirement plans
Range 8.50 to 8.90 8.50 to 9.60
Weighted average (2) 8.50 8.50
(1) For the U.S. qualified pension and postretirement plans, the 2014 and 2013 rates shown above
were utilized to calculate the expense in each of the respective four quarters in 2014 and 2013,
respectively. For the U.S. nonqualified pension plans, the 2014 and 2013 rates shown above were
utilized to calculate expense for 2014 and 2013, respectively.
(2) For the Significant non-U.S. plans, the 2014 and 2013 weighted averages shown above reflect the
rates utilized to calculate expense in the first quarters of 2014 and 2013, respectively. For all other
non-U.S. plans, the weighted averages shown above reflect the rates utilized to calculate expense for
2014 and 2013, respectively.
(3) Since the U.S. qualified pension plan has been frozen, a compensation increase rate applies only to
certain small groups of grandfathered employees accruing benefits under a final pay plan formula.
Only the future compensation increases for these grandfathered employees will affect future pension
expense and obligations. Compensation increase rates for these small groups of participants range
from 3.00% to 4.00%.