Citibank 2014 Annual Report Download - page 298
Download and view the complete annual report
Please find page 298 of the 2014 Citibank annual report below. You can navigate through the pages in the report by either clicking on the pages listed below, or by using the keyword search tool below to find specific information within the annual report.-
 1
1 -
2
-
3
-
4
-
5
-
6
-
7
-
8
-
9
-
10
-
11
-
12
-
13
-
14
-
15
-
16
-
17
-
18
-
19
-
20
-
21
-
22
-
23
-
24
-
25
-
26
-
27
-
28
-
29
-
30
-
31
-
32
-
33
-
34
-
35
-
36
-
37
-
38
-
39
-
40
-
41
-
42
-
43
-
44
-
45
-
46
-
47
-
48
-
49
-
50
-
51
-
52
-
53
-
54
-
55
-
56
-
57
-
58
-
59
-
60
-
61
-
62
-
63
-
64
-
65
-
66
-
67
-
68
-
69
-
70
-
71
-
72
-
73
-
74
-
75
-
76
-
77
-
78
-
79
-
80
-
81
-
82
-
83
-
84
-
85
-
86
-
87
-
88
-
89
-
90
-
91
-
92
-
93
-
94
-
95
-
96
-
97
-
98
-
99
-
100
-
101
-
102
-
103
-
104
-
105
-
106
-
107
-
108
-
109
-
110
-
111
-
112
-
113
-
114
-
115
-
116
-
117
-
118
-
119
-
120
-
121
-
122
-
123
-
124
-
125
-
126
-
127
-
128
-
129
-
130
-
131
-
132
-
133
-
134
-
135
-
136
-
137
-
138
-
139
-
140
-
141
-
142
-
143
-
144
-
145
-
146
-
147
-
148
-
149
-
150
-
151
-
152
-
153
-
154
-
155
-
156
-
157
-
158
-
159
-
160
-
161
-
162
-
163
-
164
-
165
-
166
-
167
-
168
-
169
-
170
-
171
-
172
-
173
-
174
-
175
-
176
-
177
-
178
-
179
-
180
-
181
-
182
-
183
-
184
-
185
-
186
-
187
-
188
-
189
-
190
-
191
-
192
-
193
-
194
-
195
-
196
-
197
-
198
-
199
-
200
-
201
-
202
-
203
-
204
-
205
-
206
-
207
-
208
-
209
-
210
-
211
-
212
-
213
-
214
-
215
-
216
-
217
-
218
-
219
-
220
-
221
-
222
-
223
-
224
-
225
-
226
-
227
-
228
-
229
-
230
-
231
-
232
-
233
-
234
-
235
-
236
-
237
-
238
-
239
-
240
-
241
-
242
-
243
-
244
-
245
-
246
-
247
-
248
-
249
-
250
-
251
-
252
-
253
-
254
-
255
-
256
-
257
-
258
-
259
-
260
-
261
-
262
-
263
-
264
-
265
-
266
-
267
-
268
-
269
-
270
-
271
-
272
-
273
-
274
-
275
-
276
-
277
-
278
-
279
-
280
-
281
-
282
-
283
-
284
-
285
-
286
-
287
-
 288
288 -
 289
289 -
 290
290 -
 291
291 -
 292
292 -
 293
293 -
 294
294 -
 295
295 -
 296
296 -
 297
297 -
 298
298 -
 299
299 -
 300
300 -
 301
301 -
 302
302 -
 303
303 -
 304
304 -
 305
305 -
 306
306 -
 307
307 -
 308
308 -
309
-
310
-
311
-
312
-
313
-
314
-
315
-
316
-
317
-
318
-
319
-
320
-
321
-
322
-
323
-
324
-
325
-
326
-
327
 |
 |

281
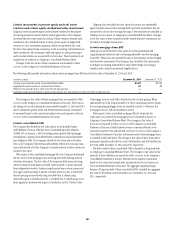
Certain investments in private equity and real estate
ventures and certain equity method and other investments
Citigroup invests in private equity and real estate ventures for the purpose
of earning investment returns and for capital appreciation. The Company
has elected the fair value option for certain of these ventures, because such
investments are considered similar to many private equity or hedge fund
activities in Citi’s investment companies, which are reported at fair value.
The fair value option brings consistency in the accounting and evaluation of
these investments. All investments (debt and equity) in such private equity
and real estate entities are accounted for at fair value. These investments are
classified as Investments on Citigroup’s Consolidated Balance Sheet.
Changes in the fair values of these investments are classified in Other
revenue in the Company’s Consolidated Statement of Income.
Citigroup also elects the fair value option for certain non-marketable
equity securities whose risk is managed with derivative instruments that are
accounted for at fair value through earnings. These securities are classified as
Trading account assets on Citigroup’s Consolidated Balance Sheet. Changes
in the fair value of these securities and the related derivative instruments are
recorded in Principal transactions.
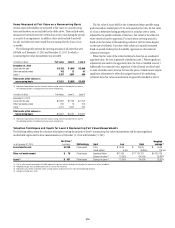
Certain mortgage loans HFS
Citigroup has elected the fair value option for certain purchased and
originated prime fixed-rate and conforming adjustable-rate first mortgage
loans HFS. These loans are intended for sale or securitization and are hedged
with derivative instruments. The Company has elected the fair value option
to mitigate accounting mismatches in cases where hedge accounting is
complex and to achieve operational simplifications.
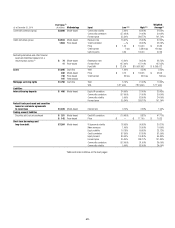
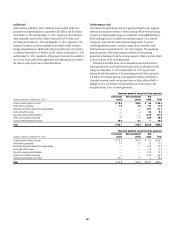
The following table provides information about certain mortgage loans HFS carried at fair value at December 31, 2014 and 2013:
In millions of dollars December 31, 2014 December 31, 2013
Carrying amount reported on the Consolidated Balance Sheet $1,447 $2,089
Aggregate fair value in excess of unpaid principal balance 67 48
Balance of non-accrual loans or loans more than 90 days past due ——
Aggregate unpaid principal balance in excess of fair value for non-accrual loans or loans more than 90 days past due ——
The changes in fair values of these mortgage loans are reported in Other
revenue in the Company’s Consolidated Statement of Income. There was no
net change in fair value during the years ended December 31, 2014 and 2013
due to instrument-specific credit risk. Related interest income continues to
be measured based on the contractual interest rates and reported as Interest
revenue in the Consolidated Statement of Income.
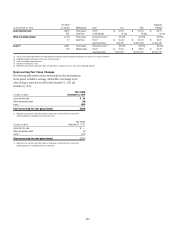
Certain consolidated VIEs
The Company has elected the fair value option for all qualified assets
and liabilities of certain VIEs that were consolidated upon the adoption
of SFAS 167 on January 1, 2010, including certain private label mortgage
securitizations, mutual fund deferred sales commissions and collateralized
loan obligation VIEs. The Company elected the fair value option for these
VIEs, as the Company believes this method better reflects the economic risks,
since substantially all of the Company’s retained interests in these entities are
carried at fair value.
With respect to the consolidated mortgage VIEs, the Company determined
the fair value for the mortgage loans and long-term debt utilizing internal
valuation techniques. The fair value of the long-term debt measured using
internal valuation techniques is verified, where possible, to prices obtained
from independent vendors. Vendors compile prices from various sources and
may apply matrix pricing for similar securities when no price is observable.
Security pricing associated with long-term debt that is valued using
observable inputs is classified as Level 2, and debt that is valued using one or
more significant unobservable inputs is classified as Level 3. The fair value
of mortgage loans in each VIE is derived from the security pricing. When
substantially all of the long-term debt of a VIE is valued using Level 2 inputs,
the corresponding mortgage loans are classified as Level 2. Otherwise, the
mortgage loans of a VIE are classified as Level 3.
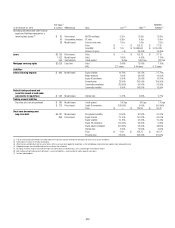
With respect to the consolidated mortgage VIEs for which the fair
value option was elected, the mortgage loans are classified as Loans on
Citigroup’s Consolidated Balance Sheet. The changes in fair value of
the loans are reported as Other revenue in the Company’s Consolidated
Statement of Income. Related interest revenue is measured based on the
contractual interest rates and reported as Interest revenue in the Company’s
Consolidated Statement of Income. Information about these mortgage loans
is included in the table below. The change in fair value of these loans due to
instrument-specific credit risk was a loss of $48 million and $156 million for
the years ended December 31, 2014 and 2013, respectively.
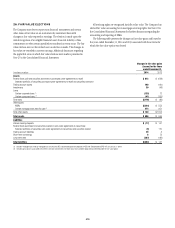
The debt issued by these consolidated VIEs is classified as long-term debt
on Citigroup’s Consolidated Balance Sheet. The changes in fair value for the
majority of these liabilities are reported in Other revenue in the Company’s
Consolidated Statement of Income. Related interest expense is measured
based on the contractual interest rates and reported as Interest expense in
the Consolidated Statement of Income. The aggregate unpaid principal
balance of long-term debt of these consolidated VIEs exceeded the aggregate
fair value by $9 million and $223 million as of December 31, 2014 and
2013, respectively.