Citibank 2014 Annual Report Download - page 45
Download and view the complete annual report
Please find page 45 of the 2014 Citibank annual report below. You can navigate through the pages in the report by either clicking on the pages listed below, or by using the keyword search tool below to find specific information within the annual report.-
 1
1 -
2
-
3
-
4
-
5
-
6
-
7
-
8
-
9
-
10
-
11
-
12
-
13
-
14
-
15
-
16
-
17
-
18
-
19
-
20
-
21
-
22
-
23
-
24
-
25
-
26
-
27
-
28
-
29
-
30
-
31
-
32
-
33
-
34
-
 35
35 -
 36
36 -
 37
37 -
 38
38 -
 39
39 -
 40
40 -
 41
41 -
 42
42 -
 43
43 -
 44
44 -
 45
45 -
 46
46 -
 47
47 -
 48
48 -
 49
49 -
 50
50 -
 51
51 -
 52
52 -
 53
53 -
 54
54 -
 55
55 -
56
-
57
-
58
-
59
-
60
-
61
-
62
-
63
-
64
-
65
-
66
-
67
-
68
-
69
-
70
-
71
-
72
-
73
-
74
-
75
-
76
-
77
-
78
-
79
-
80
-
81
-
82
-
83
-
84
-
85
-
86
-
87
-
88
-
89
-
90
-
91
-
92
-
93
-
94
-
95
-
96
-
97
-
98
-
99
-
100
-
101
-
102
-
103
-
104
-
105
-
106
-
107
-
108
-
109
-
110
-
111
-
112
-
113
-
114
-
115
-
116
-
117
-
118
-
119
-
120
-
121
-
122
-
123
-
124
-
125
-
126
-
127
-
128
-
129
-
130
-
131
-
132
-
133
-
134
-
135
-
136
-
137
-
138
-
139
-
140
-
141
-
142
-
143
-
144
-
145
-
146
-
147
-
148
-
149
-
150
-
151
-
152
-
153
-
154
-
155
-
156
-
157
-
158
-
159
-
160
-
161
-
162
-
163
-
164
-
165
-
166
-
167
-
168
-
169
-
170
-
171
-
172
-
173
-
174
-
175
-
176
-
177
-
178
-
179
-
180
-
181
-
182
-
183
-
184
-
185
-
186
-
187
-
188
-
189
-
190
-
191
-
192
-
193
-
194
-
195
-
196
-
197
-
198
-
199
-
200
-
201
-
202
-
203
-
204
-
205
-
206
-
207
-
208
-
209
-
210
-
211
-
212
-
213
-
214
-
215
-
216
-
217
-
218
-
219
-
220
-
221
-
222
-
223
-
224
-
225
-
226
-
227
-
228
-
229
-
230
-
231
-
232
-
233
-
234
-
235
-
236
-
237
-
238
-
239
-
240
-
241
-
242
-
243
-
244
-
245
-
246
-
247
-
248
-
249
-
250
-
251
-
252
-
253
-
254
-
255
-
256
-
257
-
258
-
259
-
260
-
261
-
262
-
263
-
264
-
265
-
266
-
267
-
268
-
269
-
270
-
271
-
272
-
273
-
274
-
275
-
276
-
277
-
278
-
279
-
280
-
281
-
282
-
283
-
284
-
285
-
286
-
287
-
288
-
289
-
290
-
291
-
292
-
293
-
294
-
295
-
296
-
297
-
298
-
299
-
300
-
301
-
302
-
303
-
304
-
305
-
306
-
307
-
308
-
309
-
310
-
311
-
312
-
313
-
314
-
315
-
316
-
317
-
318
-
319
-
320
-
321
-
322
-
323
-
324
-
325
-
326
-
327
 |
 |

28
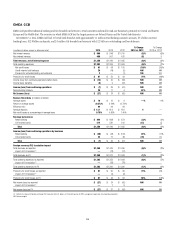
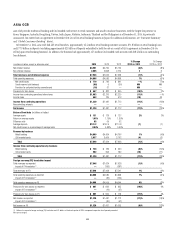
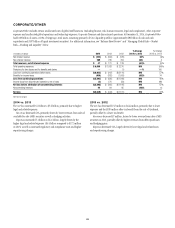
CORPORATE/OTHER
Corporate/Other includes certain unallocated costs of global staff functions (including finance, risk, human resources, legal and compliance), other corporate
expenses and unallocated global operations and technology expenses, Corporate Treasury and discontinued operations. At December 31, 2014, Corporate/Other
had $329 billion of assets, or 18% of Citigroup’s total assets, consisting primarily of Citi’s liquidity portfolio (approximately $80 billion of cash and cash
equivalents and $197 billion of liquid investment securities). For additional information, see “Balance Sheet Review” and “Managing Global Risk—Market
Risk—Funding and Liquidity” below.
In millions of dollars 2014 2013 2012
% Change
2014 vs. 2013
% Change
2013 vs. 2012
Net interest revenue $ (222) $(609) $ (576) 64% (6)%
Non-interest revenue 269 730 704 (63) 4
Total revenues, net of interest expense $ 47 $ 121 $ 128 (61)% (5)%
Total operating expenses $ 6,099 $ 1,033 $ 2,270 NM (54)%
Provisions for loan losses and for benefits and claims —— (1) —% 100
Loss from continuing operations before taxes $(6,052) $ (912) $(2,141) NM 57%
Benefits for income taxes (459) (282) (1,093) (63)% 74
Loss from continuing operations $(5,593) $ (630) $ (1,048) NM 40%
Income (loss) from discontinued operations, net of taxes (2) 270 (58) NM NM
Net loss before attribution of noncontrolling interests $(5,595) $ (360) $ (1,106) NM 67%
Noncontrolling interests 44 84 85 (48)% (1)
Net loss $(5,639) $ (444) $ (1,191) NM 63%
NM Not meaningful
2014 vs. 2013
The net loss increased $5.2 billion to $5.6 billion, primarily due to higher
legal and related expenses.
Revenues decreased 61%, primarily driven by lower revenues from sales of
available-for-sale (AFS) securities as well as hedging activities.
Expenses increased $5.1 billion to $6.1 billion, largely driven by the
higher legal and related expenses ($4.4 billion compared to $172 million
in 2013) as well as increased regulatory and compliance costs and higher
repositioning charges.
2013 vs. 2012
The net loss decreased $747 million to $444 million, primarily due to lower
expenses and the $189 million after-tax benefit from the sale of Credicard,
partially offset by a lower tax benefit.
Revenues decreased $7 million, driven by lower revenue from sales of AFS
securities in 2013, partially offset by higher revenues from debt repurchases
and hedging gains.
Expenses decreased 54%, largely driven by lower legal and related costs
and repositioning charges.