Citibank 2014 Annual Report Download - page 96
Download and view the complete annual report
Please find page 96 of the 2014 Citibank annual report below. You can navigate through the pages in the report by either clicking on the pages listed below, or by using the keyword search tool below to find specific information within the annual report.-
 1
1 -
2
-
3
-
4
-
5
-
6
-
7
-
8
-
9
-
10
-
11
-
12
-
13
-
14
-
15
-
16
-
17
-
18
-
19
-
20
-
21
-
22
-
23
-
24
-
25
-
26
-
27
-
28
-
29
-
30
-
31
-
32
-
33
-
34
-
35
-
36
-
37
-
38
-
39
-
40
-
41
-
42
-
43
-
44
-
45
-
46
-
47
-
48
-
49
-
50
-
51
-
52
-
53
-
54
-
55
-
56
-
57
-
58
-
59
-
60
-
61
-
62
-
63
-
64
-
65
-
66
-
67
-
68
-
69
-
70
-
71
-
72
-
73
-
74
-
75
-
76
-
77
-
78
-
79
-
80
-
81
-
82
-
83
-
84
-
85
-
 86
86 -
 87
87 -
 88
88 -
 89
89 -
 90
90 -
 91
91 -
 92
92 -
 93
93 -
 94
94 -
 95
95 -
 96
96 -
 97
97 -
 98
98 -
 99
99 -
 100
100 -
 101
101 -
 102
102 -
 103
103 -
 104
104 -
 105
105 -
 106
106 -
107
-
108
-
109
-
110
-
111
-
112
-
113
-
114
-
115
-
116
-
117
-
118
-
119
-
120
-
121
-
122
-
123
-
124
-
125
-
126
-
127
-
128
-
129
-
130
-
131
-
132
-
133
-
134
-
135
-
136
-
137
-
138
-
139
-
140
-
141
-
142
-
143
-
144
-
145
-
146
-
147
-
148
-
149
-
150
-
151
-
152
-
153
-
154
-
155
-
156
-
157
-
158
-
159
-
160
-
161
-
162
-
163
-
164
-
165
-
166
-
167
-
168
-
169
-
170
-
171
-
172
-
173
-
174
-
175
-
176
-
177
-
178
-
179
-
180
-
181
-
182
-
183
-
184
-
185
-
186
-
187
-
188
-
189
-
190
-
191
-
192
-
193
-
194
-
195
-
196
-
197
-
198
-
199
-
200
-
201
-
202
-
203
-
204
-
205
-
206
-
207
-
208
-
209
-
210
-
211
-
212
-
213
-
214
-
215
-
216
-
217
-
218
-
219
-
220
-
221
-
222
-
223
-
224
-
225
-
226
-
227
-
228
-
229
-
230
-
231
-
232
-
233
-
234
-
235
-
236
-
237
-
238
-
239
-
240
-
241
-
242
-
243
-
244
-
245
-
246
-
247
-
248
-
249
-
250
-
251
-
252
-
253
-
254
-
255
-
256
-
257
-
258
-
259
-
260
-
261
-
262
-
263
-
264
-
265
-
266
-
267
-
268
-
269
-
270
-
271
-
272
-
273
-
274
-
275
-
276
-
277
-
278
-
279
-
280
-
281
-
282
-
283
-
284
-
285
-
286
-
287
-
288
-
289
-
290
-
291
-
292
-
293
-
294
-
295
-
296
-
297
-
298
-
299
-
300
-
301
-
302
-
303
-
304
-
305
-
306
-
307
-
308
-
309
-
310
-
311
-
312
-
313
-
314
-
315
-
316
-
317
-
318
-
319
-
320
-
321
-
322
-
323
-
324
-
325
-
326
-
327
 |
 |

79
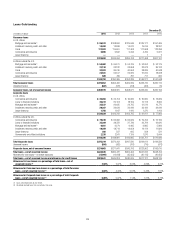
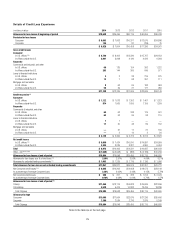
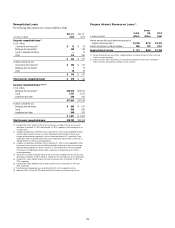
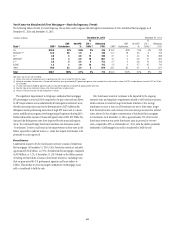
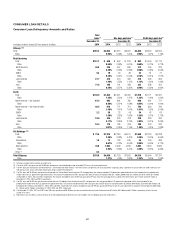
Renegotiated Loans
The following table presents Citi’s loans modified in TDRs.
In millions of dollars
Dec. 31,
2014
Dec. 31,
2013
Corporate renegotiated loans (1)
In U.S. offices
Commercial and industrial (2) $ 12 $ 36
Mortgage and real estate (3) 106 143
Loans to financial institutions —14
Other 316 364
$ 434 $ 557
In offices outside the U.S.
Commercial and industrial (2) $ 105 $ 161
Mortgage and real estate (3) 118
Other 39 58
$ 145 $ 237
Total Corporate renegotiated loans $ 579 $ 794
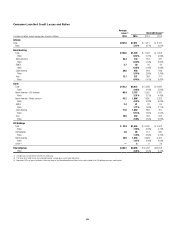
Consumer renegotiated loans (4)(5)(6)(7)
In U.S. offices
Mortgage and real estate (8) $15,514 $18,922
Cards 1,751 2,510
Installment and other 580 626
$17,845 $22,058
In offices outside the U.S.
Mortgage and real estate $ 695 $ 641
Cards 656 830
Installment and other 586 834
$ 1,937 $ 2,305
Total Consumer renegotiated loans $19,782 $24,363
(1) Includes $135 million and $312 million of non-accrual loans included in the non-accrual assets
table above at December 31, 2014 and December 31, 2013, respectively. The remaining loans are
accruing interest.
(2) In addition to modifications reflected as TDRs at December 31, 2014, Citi also modified $15 million
and $34 million of commercial loans risk rated “Substandard Non-Performing” or worse (asset
category defined by banking regulators) in offices inside and outside the U.S., respectively. These
modifications were not considered TDRs because the modifications did not involve a concession (a
required element of a TDR for accounting purposes).
(3) In addition to modifications reflected as TDRs at December 31, 2014, Citi also modified $22 million
of commercial real estate loans risk rated “Substandard Non-Performing” or worse (asset category
defined by banking regulators) in offices inside the U.S. These modifications were not considered
TDRs because the modifications did not involve a concession (a required element of a TDR for
accounting purposes).
(4) Includes $3,132 million and $3,637 million of non-accrual loans included in the non-accrual assets
table above at December 31, 2014 and 2013, respectively. The remaining loans are accruing interest.
(5) Includes $124 million and $29 million of commercial real estate loans at December 31, 2014 and
2013, respectively.
(6) Includes $184 million and $295 million of other commercial loans at December 31, 2014 and
2013, respectively.
(7) Smaller-balance homogeneous loans were derived from Citi’s risk management systems.
(8) Reduction in 2014 includes $2,901 million related to TDRs sold or transferred to held-for-sale.
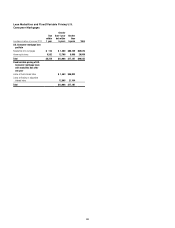
Forgone Interest Revenue on Loans (1)
In millions of dollars
In U.S.
offices
In non-
U.S.
offices
2014
total
Interest revenue that would have been accrued at
original contractual rates (2) $1,708 $715 $2,423
Amount recognized as interest revenue (2) 996 261 1,257
Forgone interest revenue $ 712 $454 $ 1,166
(1) Relates to Corporate non-accrual loans, renegotiated loans and Consumer loans on which accrual of
interest has been suspended.
(2) Interest revenue in offices outside the U.S. may reflect prevailing local interest rates, including the
effects of inflation and monetary correction in certain countries.