Citibank 2014 Annual Report Download - page 44
Download and view the complete annual report
Please find page 44 of the 2014 Citibank annual report below. You can navigate through the pages in the report by either clicking on the pages listed below, or by using the keyword search tool below to find specific information within the annual report.-
 1
1 -
2
-
3
-
4
-
5
-
6
-
7
-
8
-
9
-
10
-
11
-
12
-
13
-
14
-
15
-
16
-
17
-
18
-
19
-
20
-
21
-
22
-
23
-
24
-
25
-
26
-
27
-
28
-
29
-
30
-
31
-
32
-
33
-
 34
34 -
 35
35 -
 36
36 -
 37
37 -
 38
38 -
 39
39 -
 40
40 -
 41
41 -
 42
42 -
 43
43 -
 44
44 -
 45
45 -
 46
46 -
 47
47 -
 48
48 -
 49
49 -
 50
50 -
 51
51 -
 52
52 -
 53
53 -
 54
54 -
55
-
56
-
57
-
58
-
59
-
60
-
61
-
62
-
63
-
64
-
65
-
66
-
67
-
68
-
69
-
70
-
71
-
72
-
73
-
74
-
75
-
76
-
77
-
78
-
79
-
80
-
81
-
82
-
83
-
84
-
85
-
86
-
87
-
88
-
89
-
90
-
91
-
92
-
93
-
94
-
95
-
96
-
97
-
98
-
99
-
100
-
101
-
102
-
103
-
104
-
105
-
106
-
107
-
108
-
109
-
110
-
111
-
112
-
113
-
114
-
115
-
116
-
117
-
118
-
119
-
120
-
121
-
122
-
123
-
124
-
125
-
126
-
127
-
128
-
129
-
130
-
131
-
132
-
133
-
134
-
135
-
136
-
137
-
138
-
139
-
140
-
141
-
142
-
143
-
144
-
145
-
146
-
147
-
148
-
149
-
150
-
151
-
152
-
153
-
154
-
155
-
156
-
157
-
158
-
159
-
160
-
161
-
162
-
163
-
164
-
165
-
166
-
167
-
168
-
169
-
170
-
171
-
172
-
173
-
174
-
175
-
176
-
177
-
178
-
179
-
180
-
181
-
182
-
183
-
184
-
185
-
186
-
187
-
188
-
189
-
190
-
191
-
192
-
193
-
194
-
195
-
196
-
197
-
198
-
199
-
200
-
201
-
202
-
203
-
204
-
205
-
206
-
207
-
208
-
209
-
210
-
211
-
212
-
213
-
214
-
215
-
216
-
217
-
218
-
219
-
220
-
221
-
222
-
223
-
224
-
225
-
226
-
227
-
228
-
229
-
230
-
231
-
232
-
233
-
234
-
235
-
236
-
237
-
238
-
239
-
240
-
241
-
242
-
243
-
244
-
245
-
246
-
247
-
248
-
249
-
250
-
251
-
252
-
253
-
254
-
255
-
256
-
257
-
258
-
259
-
260
-
261
-
262
-
263
-
264
-
265
-
266
-
267
-
268
-
269
-
270
-
271
-
272
-
273
-
274
-
275
-
276
-
277
-
278
-
279
-
280
-
281
-
282
-
283
-
284
-
285
-
286
-
287
-
288
-
289
-
290
-
291
-
292
-
293
-
294
-
295
-
296
-
297
-
298
-
299
-
300
-
301
-
302
-
303
-
304
-
305
-
306
-
307
-
308
-
309
-
310
-
311
-
312
-
313
-
314
-
315
-
316
-
317
-
318
-
319
-
320
-
321
-
322
-
323
-
324
-
325
-
326
-
327
 |
 |
27
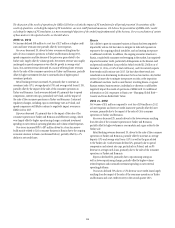
Russia
Citi continues to monitor and manage its exposures in ICG resulting from
the instability in Russia and Ukraine. As discussed above, the ongoing
uncertainties created by the instability in the region have impacted markets
in the region, including certain of Citi’s markets businesses, and could
continue to do so in the future. Any actions Citi may take to mitigate its
exposures or risks, or the imposition of additional sanctions (such as asset
freezes) involving Russia or against Russian entities, business sectors,
individuals or otherwise, could negatively impact the results of operations of
EMEA ICG. For additional information on Citi’s exposures in these countries,
see “Managing Global Risk—Country and Cross-Border Risk” below.
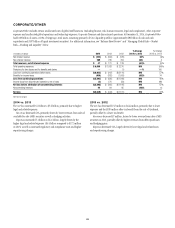
2013 vs. 2012
Net income increased 3%, primarily driven by higher revenues and lower
expenses and credit costs, partially offset by a higher effective tax rate.
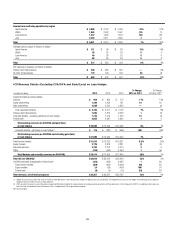
• Revenues increased 2%, primarily reflecting higher revenues in Banking
(increase of 4%, 1% excluding the gains/(losses) on hedges on accrual
loans) and in Markets and securities services (increase of 1%).
Within Banking:
• Investment banking revenues increased 8%, reflecting gains in overall
investment banking wallet share. Advisory revenues increased 19%,
reflecting an improvement in wallet share, despite a contraction in the
overall M&A market wallet. Equity underwriting revenues increased
45%, driven by improved wallet share and increased market activity,
particularly initial public offerings. Debt underwriting revenues decreased
6%, primarily due to lower bond underwriting fees and a decline in wallet
share during the year.
• Treasury and trade solutions revenues decreased 3%, as the ongoing
impact of spread compression globally was partially offset by higher
balances and fee growth. Average deposits increased 7% and average
trade loans increased 22%, including the impact of the consolidation of
approximately $7 billion of trade loans during the second quarter of 2013.
• Corporate lending revenues increased 40%. Excluding the impact of
gains/(losses) on hedges on accrual loans, revenues decreased 4%,
primarily due to increased hedge premium costs and moderately lower
loan balances, partially offset by higher spreads.
• Private bank revenues increased 4%, with growth across all regions and
products, particularly in managed investments, where growth reflected
both higher client assets under management and increased placement
fees, as well as in capital markets. Revenue growth in lending and
deposits, primarily driven by growth in client volumes, was partially offset
by continued spread compression.
Within Markets and securities services:
• Fixed income markets revenues decreased 7%, primarily reflecting
industry-wide weakness in rates and currencies, partially offset by strong
performance in credit-related and securitized products and commodities.
Rates and currencies performance was lower compared to a strong 2012
that benefited from increased client revenues and a more liquid market
environment, particularly in EMEA. 2013 results also reflected a general
slowdown in client activity exacerbated by uncertainty around the
tapering of quantitative easing as well as geopolitical issues. Credit-related
and securitized products results reflected increased client activity driven by
improved market conditions and demand for spread products.
• Equity markets revenues increased 24%, primarily due to market
share gains, continued improvement in cash and derivative trading
performance and a more favorable market environment.
• Securities services revenues increased 3%, as settlement volumes
increased 15% and assets under custody increased 8%, partially offset by
spread compression related to deposits.
Expenses decreased 2%, primarily reflecting repositioning savings, the
impact of lower performance-based compensation, lower repositioning
charges and the impact of FX translation, partially offset by the net fraud
loss in 2013 as well as higher legal and related costs and volume-related
expenses. Excluding the impact of the net fraud loss, expenses decreased 4%,
primarily reflecting repositioning savings, the impact of lower performance-
based compensation, lower repositioning charges and the impact of FX
translation, partially offset by higher legal and related costs and volume-
related expenses.
Provisions decreased 72%, primarily reflecting higher loan loss reserve
releases and lower net credit losses.