Citibank 2014 Annual Report Download - page 91
Download and view the complete annual report
Please find page 91 of the 2014 Citibank annual report below. You can navigate through the pages in the report by either clicking on the pages listed below, or by using the keyword search tool below to find specific information within the annual report.-
 1
1 -
2
-
3
-
4
-
5
-
6
-
7
-
8
-
9
-
10
-
11
-
12
-
13
-
14
-
15
-
16
-
17
-
18
-
19
-
20
-
21
-
22
-
23
-
24
-
25
-
26
-
27
-
28
-
29
-
30
-
31
-
32
-
33
-
34
-
35
-
36
-
37
-
38
-
39
-
40
-
41
-
42
-
43
-
44
-
45
-
46
-
47
-
48
-
49
-
50
-
51
-
52
-
53
-
54
-
55
-
56
-
57
-
58
-
59
-
60
-
61
-
62
-
63
-
64
-
65
-
66
-
67
-
68
-
69
-
70
-
71
-
72
-
73
-
74
-
75
-
76
-
77
-
78
-
79
-
80
-
 81
81 -
 82
82 -
 83
83 -
 84
84 -
 85
85 -
 86
86 -
 87
87 -
 88
88 -
 89
89 -
 90
90 -
 91
91 -
 92
92 -
 93
93 -
 94
94 -
 95
95 -
 96
96 -
 97
97 -
 98
98 -
 99
99 -
 100
100 -
 101
101 -
102
-
103
-
104
-
105
-
106
-
107
-
108
-
109
-
110
-
111
-
112
-
113
-
114
-
115
-
116
-
117
-
118
-
119
-
120
-
121
-
122
-
123
-
124
-
125
-
126
-
127
-
128
-
129
-
130
-
131
-
132
-
133
-
134
-
135
-
136
-
137
-
138
-
139
-
140
-
141
-
142
-
143
-
144
-
145
-
146
-
147
-
148
-
149
-
150
-
151
-
152
-
153
-
154
-
155
-
156
-
157
-
158
-
159
-
160
-
161
-
162
-
163
-
164
-
165
-
166
-
167
-
168
-
169
-
170
-
171
-
172
-
173
-
174
-
175
-
176
-
177
-
178
-
179
-
180
-
181
-
182
-
183
-
184
-
185
-
186
-
187
-
188
-
189
-
190
-
191
-
192
-
193
-
194
-
195
-
196
-
197
-
198
-
199
-
200
-
201
-
202
-
203
-
204
-
205
-
206
-
207
-
208
-
209
-
210
-
211
-
212
-
213
-
214
-
215
-
216
-
217
-
218
-
219
-
220
-
221
-
222
-
223
-
224
-
225
-
226
-
227
-
228
-
229
-
230
-
231
-
232
-
233
-
234
-
235
-
236
-
237
-
238
-
239
-
240
-
241
-
242
-
243
-
244
-
245
-
246
-
247
-
248
-
249
-
250
-
251
-
252
-
253
-
254
-
255
-
256
-
257
-
258
-
259
-
260
-
261
-
262
-
263
-
264
-
265
-
266
-
267
-
268
-
269
-
270
-
271
-
272
-
273
-
274
-
275
-
276
-
277
-
278
-
279
-
280
-
281
-
282
-
283
-
284
-
285
-
286
-
287
-
288
-
289
-
290
-
291
-
292
-
293
-
294
-
295
-
296
-
297
-
298
-
299
-
300
-
301
-
302
-
303
-
304
-
305
-
306
-
307
-
308
-
309
-
310
-
311
-
312
-
313
-
314
-
315
-
316
-
317
-
318
-
319
-
320
-
321
-
322
-
323
-
324
-
325
-
326
-
327
 |
 |

74
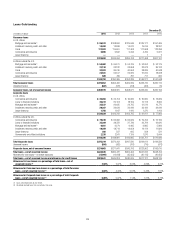
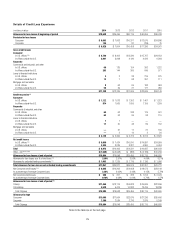
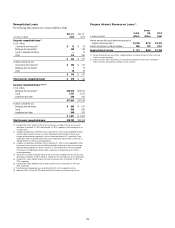
Loans Outstanding
December 31,
In millions of dollars 2014 2013 2012 2011 2010
Consumer loans
In U.S. offices
Mortgage and real estate (1) $ 96,533 $108,453 $125,946 $139,177 $151,469
Installment, revolving credit, and other 14,450 13,398 14,070 15,616 28,291
Cards 112,982 115,651 111,403 117,908 122,384
Commercial and industrial 5,895 6,592 5,344 4,766 5,021
Lease financing —— — 1 2
$229,860 $244,094 $256,763 $277,468 $307,167
In offices outside the U.S.
Mortgage and real estate (1) $ 54,462 $ 55,511 $ 54,709 $ 52,052 $ 52,175
Installment, revolving credit, and other 31,128 33,182 33,958 32,673 36,132
Cards 32,032 36,740 40,653 38,926 40,948
Commercial and industrial 22,561 24,107 22,225 21,915 18,028
Lease financing 609 769 781 711 665
$140,792 $150,309 $152,326 $146,277 $147,948
Total Consumer loans $370,652 $394,403 $409,089 $423,745 $455,115
Unearned income (682) (572) (418) (405) 69
Consumer loans, net of unearned income $369,970 $393,831 $408,671 $423,340 $455,184
Corporate loans
In U.S. offices
Commercial and industrial $ 35,055 $ 32,704 $ 26,985 $ 20,830 $ 13,669
Loans to financial institutions 36,272 25,102 18,159 15,113 8,995
Mortgage and real estate (1) 32,537 29,425 24,705 21,516 19,770
Installment, revolving credit, and other 29,207 34,434 32,446 33,182 34,046
Lease financing 1,758 1,647 1,410 1,270 1,413
$134,829 $123,312 $103,705 $ 91,911 $ 77,893
In offices outside the U.S.
Commercial and industrial $ 79,239 $ 82,663 $ 82,939 $ 79,764 $ 72,166
Loans to financial institutions 33,269 38,372 37,739 29,794 22,620
Mortgage and real estate (1) 6,031 6,274 6,485 6,885 5,899
Installment, revolving credit, and other 19,259 18,714 14,958 14,114 11,829
Lease financing 356 527 605 568 531
Governments and official institutions 2,236 2,341 1,159 1,576 3,644
$140,390 $148,891 $143,885 $132,701 $116,689
Total Corporate loans $275,219 $272,203 $247,590 $224,612 $194,582
Unearned income (554) (562) (797) (710) (972)
Corporate loans, net of unearned income $274,665 $271,641 $246,793 $223,902 $193,610
Total loans—net of unearned income $644,635 $665,472 $655,464 $647,242 $648,794
Allowance for loan losses—on drawn exposures (15,994) (19,648) (25,455) (30,115) (40,655)
Total loans—net of unearned income and allowance for credit losses $628,641 $645,824 $630,009 $617,127 $608,139
Allowance for loan losses as a percentage of total loans—net of
unearned income (2) 2.50% 2.97% 3.92% 4.69% 6.31%
Allowance for Consumer loan losses as a percentage of total Consumer
loans—net of unearned income (2) 3.68% 4.34% 5.57% 6.45% 7.81%
Allowance for Corporate loan losses as a percentage of total Corporate
loans—net of unearned income (2) 0.89% 0.97% 1.14% 1.31% 2.75%
(1) Loans secured primarily by real estate.
(2) All periods exclude loans that are carried at fair value.