Citibank 2011 Annual Report Download - page 99
Download and view the complete annual report
Please find page 99 of the 2011 Citibank annual report below. You can navigate through the pages in the report by either clicking on the pages listed below, or by using the keyword search tool below to find specific information within the annual report.-
 1
1 -
2
-
3
-
4
-
5
-
6
-
7
-
8
-
9
-
10
-
11
-
12
-
13
-
14
-
15
-
16
-
17
-
18
-
19
-
20
-
21
-
22
-
23
-
24
-
25
-
26
-
27
-
28
-
29
-
30
-
31
-
32
-
33
-
34
-
35
-
36
-
37
-
38
-
39
-
40
-
41
-
42
-
43
-
44
-
45
-
46
-
47
-
48
-
49
-
50
-
51
-
52
-
53
-
54
-
55
-
56
-
57
-
58
-
59
-
60
-
61
-
62
-
63
-
64
-
65
-
66
-
67
-
68
-
69
-
70
-
71
-
72
-
73
-
74
-
75
-
76
-
77
-
78
-
79
-
80
-
81
-
82
-
83
-
84
-
85
-
86
-
87
-
88
-
 89
89 -
 90
90 -
 91
91 -
 92
92 -
 93
93 -
 94
94 -
 95
95 -
 96
96 -
 97
97 -
 98
98 -
 99
99 -
 100
100 -
 101
101 -
 102
102 -
 103
103 -
 104
104 -
 105
105 -
 106
106 -
 107
107 -
 108
108 -
 109
109 -
110
-
111
-
112
-
113
-
114
-
115
-
116
-
117
-
118
-
119
-
120
-
121
-
122
-
123
-
124
-
125
-
126
-
127
-
128
-
129
-
130
-
131
-
132
-
133
-
134
-
135
-
136
-
137
-
138
-
139
-
140
-
141
-
142
-
143
-
144
-
145
-
146
-
147
-
148
-
149
-
150
-
151
-
152
-
153
-
154
-
155
-
156
-
157
-
158
-
159
-
160
-
161
-
162
-
163
-
164
-
165
-
166
-
167
-
168
-
169
-
170
-
171
-
172
-
173
-
174
-
175
-
176
-
177
-
178
-
179
-
180
-
181
-
182
-
183
-
184
-
185
-
186
-
187
-
188
-
189
-
190
-
191
-
192
-
193
-
194
-
195
-
196
-
197
-
198
-
199
-
200
-
201
-
202
-
203
-
204
-
205
-
206
-
207
-
208
-
209
-
210
-
211
-
212
-
213
-
214
-
215
-
216
-
217
-
218
-
219
-
220
-
221
-
222
-
223
-
224
-
225
-
226
-
227
-
228
-
229
-
230
-
231
-
232
-
233
-
234
-
235
-
236
-
237
-
238
-
239
-
240
-
241
-
242
-
243
-
244
-
245
-
246
-
247
-
248
-
249
-
250
-
251
-
252
-
253
-
254
-
255
-
256
-
257
-
258
-
259
-
260
-
261
-
262
-
263
-
264
-
265
-
266
-
267
-
268
-
269
-
270
-
271
-
272
-
273
-
274
-
275
-
276
-
277
-
278
-
279
-
280
-
281
-
282
-
283
-
284
-
285
-
286
-
287
-
288
-
289
-
290
-
291
-
292
-
293
-
294
-
295
-
296
-
297
-
298
-
299
-
300
-
301
-
302
-
303
-
304
-
305
-
306
-
307
-
308
-
309
-
310
-
311
-
312
-
313
-
314
-
315
-
316
-
317
-
318
-
319
-
320
 |
 |

77
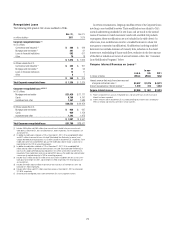
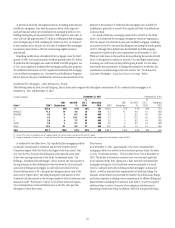
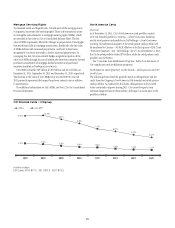
As previously disclosed, management actions, including asset sales and
modification programs, have been the primary drivers of the improved
asset performance within Citi’s residential first mortgage portfolio in Citi
Holdings during the periods presented above. With respect to asset sales, in
total, Citi has sold approximately $7.6 billion of delinquent first mortgages
since the beginning of 2010, including $2.7 billion in 2011. As evidenced
by the numbers above, the pace of Citi’s sales of residential first mortgages
has slowed, primarily due to the lack of remaining eligible inventory
and demand.
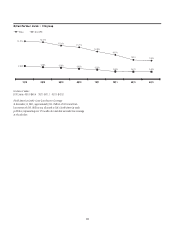
Regarding modifications of residential first mortgages, since the third
quarter of 2009, Citi has permanently modified approximately $6.1 billion
of residential first mortgage loans under its HAMP and CSM programs, two
of Citi’s more significant residential first mortgage modification programs.
(For additional information on Citi’s significant residential first mortgage
loan modification programs, see “Consumer Loan Modification Programs”
below.) However, the pace of modification activity has also slowed due to the
decrease in the inventory of residential first mortgage loans available for
modification, primarily as a result of the significant levels of modifications
in prior periods.
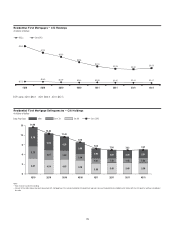
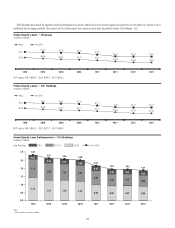
As a result of these two converging trends and as set forth in the tables
above, Citi’s residential first mortgage delinquency trends are beginning to
show the impact of re-defaults of previously modified mortgages, including
an increase in the 90+ days past due delinquencies during the fourth quarter
of 2011, although the re-default rates for the HAMP and CSM programs
continued to track favorably versus expectations as of December 31, 2011.
While net credit losses in this portfolio decreased during the periods set forth
above, if delinquencies continue to increase, Citi could begin experiencing
increasing net credit losses in this portfolio going forward. Citi has taken
these trends and uncertainties, including the potential for re-defaults, into
consideration in determining its loan loss reserves. See “North America
Consumer Mortgages – Loan Loss Reserve Coverage” below.
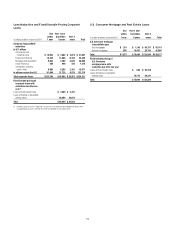
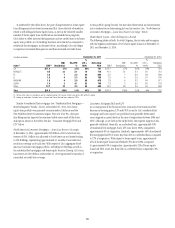
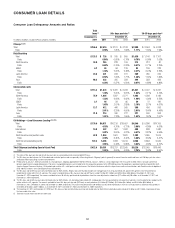
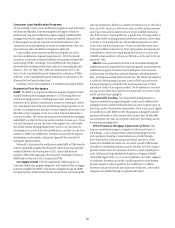
Residential First Mortgages – State Delinquency Trends
The following tables set forth, for total Citigroup, the six states and/or regions with the highest concentration of Citi’s residential first mortgages as of
December 31, 2011 and December 31, 2010.
In billions of dollars December 31, 2011 $ECEMBERææ
State (1) ENR (2)
ENR
Distribution
90+DPD
%
%
LTV >
100%
Refreshed
FICO %.2æ
%.2æ
$ISTRIBUTION
$0$æ
æ
,46ææ
2EFRESHEDæ
&)#/
#! $22.6 28% 2.7% 38% 727
.9.*#4 11.2 14 4.9 10 712
)./(-) 4.6 6 6.3 44 650
&, 4.3 5 10.2 57 668
), 3.5 4 7.2 45 686
!:.6 2.3 3 5.7 73 698
/THER 33.2 41 5.8 21 663
Total $81.7 100% 5.1% 30% 689
æ #ERTAINæOFæTHEæSTATESæAREæINCLUDEDæASæPARTæOFæAæREGIONæBASEDæONæ#ITISæVIEWæOFæSIMILARæHOMEæPRICESæ(0)æWITHINæTHEæREGION
æ %NDINGæNETæRECEIVABLESæ%XCLUDESæLOANSæINæ#ANADAæANDæ0UERTOæ2ICOæLOANSæGUARANTEEDæBYæ53æGOVERNMENTæAGENCIESæLOANSæRECORDEDæATæFAIRæVALUEæANDæLOANSæSUBJECTæTOæ,43#S
As evidenced by the tables above, Citi’s residential first mortgages portfolio
is primarily concentrated in California and the New York/New Jersey/
Connecticut region (with New York as the largest of the three states). Year
over year, the 90+ days past due delinquency rate improved across each
of the states and regions shown in the tables. As referenced under “Citi
Holdings—Residential First Mortgages” above, however, the vast majority of
the improvement in these delinquency rates was driven by Citi’s continued
asset sales of delinquent mortgages. As asset sales have slowed, Citi has
observed deterioration in 90+ days past due delinquencies for each of the
states and/or regions above, including during the fourth quarter of 2011.
Combined with the increase in the average number of days to foreclosure (see
discussion under “Foreclosures” below) in all of these states and regions,
Citi could experience continued deterioration in the 90+ days past due
delinquency rate in these areas.
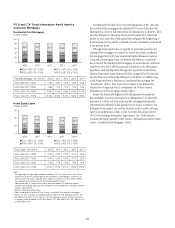
Foreclosures
As of December 31, 2011, approximately 2.5% of Citi’s residential first
mortgage portfolio was actively in the foreclosure process, which Citi refers
to as its “foreclosure inventory.” This was down from 3.1% at December 31,
2010. The decline in foreclosure inventory year over year was largely due
to two separate trends. First, during 2011, there were fewer residential first
mortgages moving into Citi’s foreclosure inventory primarily as a result
of Citi’s continued asset sales of delinquent first mortgages (as discussed
above), as well as increased state requirements for foreclosure filings. For
example, certain states have increased the number of pre-foreclosure filings
and notices required, including various requirements for affidavit filings and
demand letters (including the contents of such letters), as well as required
additional time to review a borrower’s loss mitigation activities prior to
permitting a foreclosure filing. In addition, while Citi may generally begin