Citibank 2011 Annual Report Download - page 132
Download and view the complete annual report
Please find page 132 of the 2011 Citibank annual report below. You can navigate through the pages in the report by either clicking on the pages listed below, or by using the keyword search tool below to find specific information within the annual report.-
 1
1 -
2
-
3
-
4
-
5
-
6
-
7
-
8
-
9
-
10
-
11
-
12
-
13
-
14
-
15
-
16
-
17
-
18
-
19
-
20
-
21
-
22
-
23
-
24
-
25
-
26
-
27
-
28
-
29
-
30
-
31
-
32
-
33
-
34
-
35
-
36
-
37
-
38
-
39
-
40
-
41
-
42
-
43
-
44
-
45
-
46
-
47
-
48
-
49
-
50
-
51
-
52
-
53
-
54
-
55
-
56
-
57
-
58
-
59
-
60
-
61
-
62
-
63
-
64
-
65
-
66
-
67
-
68
-
69
-
70
-
71
-
72
-
73
-
74
-
75
-
76
-
77
-
78
-
79
-
80
-
81
-
82
-
83
-
84
-
85
-
86
-
87
-
88
-
89
-
90
-
91
-
92
-
93
-
94
-
95
-
96
-
97
-
98
-
99
-
100
-
101
-
102
-
103
-
104
-
105
-
106
-
107
-
108
-
109
-
110
-
111
-
112
-
113
-
114
-
115
-
116
-
117
-
118
-
119
-
120
-
121
-
 122
122 -
 123
123 -
 124
124 -
 125
125 -
 126
126 -
 127
127 -
 128
128 -
 129
129 -
 130
130 -
 131
131 -
 132
132 -
 133
133 -
 134
134 -
 135
135 -
 136
136 -
 137
137 -
 138
138 -
 139
139 -
 140
140 -
 141
141 -
 142
142 -
143
-
144
-
145
-
146
-
147
-
148
-
149
-
150
-
151
-
152
-
153
-
154
-
155
-
156
-
157
-
158
-
159
-
160
-
161
-
162
-
163
-
164
-
165
-
166
-
167
-
168
-
169
-
170
-
171
-
172
-
173
-
174
-
175
-
176
-
177
-
178
-
179
-
180
-
181
-
182
-
183
-
184
-
185
-
186
-
187
-
188
-
189
-
190
-
191
-
192
-
193
-
194
-
195
-
196
-
197
-
198
-
199
-
200
-
201
-
202
-
203
-
204
-
205
-
206
-
207
-
208
-
209
-
210
-
211
-
212
-
213
-
214
-
215
-
216
-
217
-
218
-
219
-
220
-
221
-
222
-
223
-
224
-
225
-
226
-
227
-
228
-
229
-
230
-
231
-
232
-
233
-
234
-
235
-
236
-
237
-
238
-
239
-
240
-
241
-
242
-
243
-
244
-
245
-
246
-
247
-
248
-
249
-
250
-
251
-
252
-
253
-
254
-
255
-
256
-
257
-
258
-
259
-
260
-
261
-
262
-
263
-
264
-
265
-
266
-
267
-
268
-
269
-
270
-
271
-
272
-
273
-
274
-
275
-
276
-
277
-
278
-
279
-
280
-
281
-
282
-
283
-
284
-
285
-
286
-
287
-
288
-
289
-
290
-
291
-
292
-
293
-
294
-
295
-
296
-
297
-
298
-
299
-
300
-
301
-
302
-
303
-
304
-
305
-
306
-
307
-
308
-
309
-
310
-
311
-
312
-
313
-
314
-
315
-
316
-
317
-
318
-
319
-
320
 |
 |
110
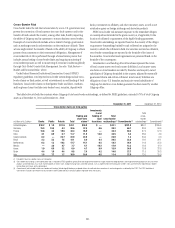
When Citi purchases credit default swaps as a hedge against a credit
exposure, Citi generally seeks to purchase products with a maturity date
similar to the exposure against which the protection is purchased. While
certain exposures may have longer maturities that extend beyond the credit
default swap tenors readily available in the market, Citi generally will
purchase credit protection with a maximum tenor that is readily available in
the market.
The above table contains all net credit default swaps (CDSs) purchased
or sold on GIIPS or French underlying entities, whether part of a trading
strategy or as purchased credit protection. With respect to the $16.9 billion
net purchased CDS contracts on underlying GIIPS reference entities,
approximately 89% has been purchased from non-GIIPS counterparties.
With respect to the $10.4 billion net purchased CDS contracts on underlying
French reference entities, approximately 72% has been purchased from non-
French counterparties. The net credit exposure to any counterparties arising
from these transactions, including any GIIPS or French counterparties, is
managed and mitigated through legally enforceable netting and margining
agreements. When Citi purchases credit default swaps as a hedge against a
credit exposure, it generally seeks to purchase products from counterparties
that would not be correlated with the underlying credit exposure it
is hedging.
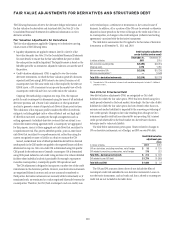
Secured Financing Transactions
As part of its banking activities with its clients, Citi enters into secured
financing transactions, such as repurchase agreements and reverse
repurchase agreements. These transactions typically involve the lending of
cash, against which securities are taken as collateral. The amount of cash
loaned against the securities collateral is a function of the liquidity and
quality of the collateral as well as the credit quality of the counterparty. The
collateral is typically marked to market daily, and Citi has the ability to call
for additional collateral (usually in the form of cash), if the value of the
securities falls below a pre-defined threshold.
As of December 31, 2011, Citi had loaned $19.2 billion in cash through
secured financing transactions with GIIPS or French counterparties, usually
through reverse repurchase agreements, as shown in the table below. Against
those loans, it held approximately $21.2 billion fair value of securities
collateral as well as $1.1 billion in variation margin, most of which was
in cash.
Consistent with Citi’s risk management systems, secured financing
transactions are included in the counterparty derivative mark-to-market
exposure at their net credit exposure value, which is typically small or zero
given the over-collateralized structure of these transactions.
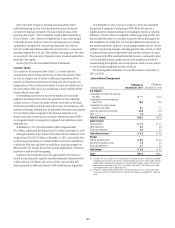
In billions of dollars Cash financing out Securities collateral in (1)
,ENDINGæTOæ'))03æANDæ&RENCHæCOUNTERPARTIESæTHROUGHæSECUREDæFINANCINGæTRANSACTIONSæ $19.2 $21.2
æ #ITIæHASæALSOæRECEIVEDæAPPROXIMATELYææBILLIONæINæVARIATIONæMARGINæPREDOMINATELYæCASHæASSOCIATEDæWITHæSECUREDæFINANCINGæTRANSACTIONSæWITHæTHESEæCOUNTERPARTIES
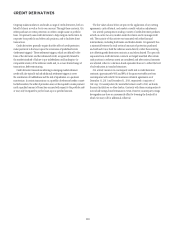
Collateral taken in against secured financing transactions is generally
high quality, marketable securities, consisting of government debt, corporate
debt, or asset-backed securities.
The table below sets forth the fair value of the securities collateral taken in
by Citi against secured financing transactions as of December 31, 2011.
In billions of dollars Total
Government
bonds
Municipal or corporate
bonds
Asset-backed
bonds
3ECURITIESæPLEDGEDæBYæ'))03æORæ&RENCHæCOUNTERPARTIESæINæSECUREDæFINANCINGæTRANSACTIONæLENDINGæ $21.2 $10.3 $0.7 $10.2
)NVESTMENTæGRADE $20.3 $10.2 $0.4 $ 9.8
.ONINVESTMENTæGRADE 0.2 0.2 0.1 —
.OTæRATED 0.7 — 0.2 0.4
æ 4OTALæINCLUDESæAPPROXIMATELYææBILLIONæINæCORRELATEDæRISKæCOLLATERALæPREDOMINATELYæ&RENCHæSOVEREIGNæDEBTæPLEDGEDæBYæ&RENCHæCOUNTERPARTIES
Secured financing transactions can be short term or can extend beyond
one year. In most cases, Citi has the right to call for additional margin
daily, and can terminate the transaction and liquidate the collateral if the
counterparty fails to post the additional margin.
The table below sets forth the remaining transaction tenor for these
transactions as of December 31, 2011.
Remaining transaction tenor
In billions of dollars Total <1 year 1-3 years 3-4 years (1)
#ASHæEXTENDEDæTOæ'))03æORæ&RENCHæCOUNTERPARTIESæINæSECUREDæFINANCINGæTRANSACTIONSæLENDINGæ $19.2 $11.6 $6.1 $1.5
æ 4HEæLONGESTæREMAININGæTENORæTRADESæMATUREæ*ANUARYæ