Citibank 2011 Annual Report Download - page 55
Download and view the complete annual report
Please find page 55 of the 2011 Citibank annual report below. You can navigate through the pages in the report by either clicking on the pages listed below, or by using the keyword search tool below to find specific information within the annual report.-
 1
1 -
2
-
3
-
4
-
5
-
6
-
7
-
8
-
9
-
10
-
11
-
12
-
13
-
14
-
15
-
16
-
17
-
18
-
19
-
20
-
21
-
22
-
23
-
24
-
25
-
26
-
27
-
28
-
29
-
30
-
31
-
32
-
33
-
34
-
35
-
36
-
37
-
38
-
39
-
40
-
41
-
42
-
43
-
44
-
 45
45 -
 46
46 -
 47
47 -
 48
48 -
 49
49 -
 50
50 -
 51
51 -
 52
52 -
 53
53 -
 54
54 -
 55
55 -
 56
56 -
 57
57 -
 58
58 -
 59
59 -
 60
60 -
 61
61 -
 62
62 -
 63
63 -
 64
64 -
 65
65 -
66
-
67
-
68
-
69
-
70
-
71
-
72
-
73
-
74
-
75
-
76
-
77
-
78
-
79
-
80
-
81
-
82
-
83
-
84
-
85
-
86
-
87
-
88
-
89
-
90
-
91
-
92
-
93
-
94
-
95
-
96
-
97
-
98
-
99
-
100
-
101
-
102
-
103
-
104
-
105
-
106
-
107
-
108
-
109
-
110
-
111
-
112
-
113
-
114
-
115
-
116
-
117
-
118
-
119
-
120
-
121
-
122
-
123
-
124
-
125
-
126
-
127
-
128
-
129
-
130
-
131
-
132
-
133
-
134
-
135
-
136
-
137
-
138
-
139
-
140
-
141
-
142
-
143
-
144
-
145
-
146
-
147
-
148
-
149
-
150
-
151
-
152
-
153
-
154
-
155
-
156
-
157
-
158
-
159
-
160
-
161
-
162
-
163
-
164
-
165
-
166
-
167
-
168
-
169
-
170
-
171
-
172
-
173
-
174
-
175
-
176
-
177
-
178
-
179
-
180
-
181
-
182
-
183
-
184
-
185
-
186
-
187
-
188
-
189
-
190
-
191
-
192
-
193
-
194
-
195
-
196
-
197
-
198
-
199
-
200
-
201
-
202
-
203
-
204
-
205
-
206
-
207
-
208
-
209
-
210
-
211
-
212
-
213
-
214
-
215
-
216
-
217
-
218
-
219
-
220
-
221
-
222
-
223
-
224
-
225
-
226
-
227
-
228
-
229
-
230
-
231
-
232
-
233
-
234
-
235
-
236
-
237
-
238
-
239
-
240
-
241
-
242
-
243
-
244
-
245
-
246
-
247
-
248
-
249
-
250
-
251
-
252
-
253
-
254
-
255
-
256
-
257
-
258
-
259
-
260
-
261
-
262
-
263
-
264
-
265
-
266
-
267
-
268
-
269
-
270
-
271
-
272
-
273
-
274
-
275
-
276
-
277
-
278
-
279
-
280
-
281
-
282
-
283
-
284
-
285
-
286
-
287
-
288
-
289
-
290
-
291
-
292
-
293
-
294
-
295
-
296
-
297
-
298
-
299
-
300
-
301
-
302
-
303
-
304
-
305
-
306
-
307
-
308
-
309
-
310
-
311
-
312
-
313
-
314
-
315
-
316
-
317
-
318
-
319
-
320
 |
 |
33
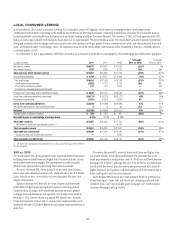
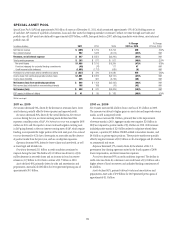
2010 vs. 2009
Net loss decreased 52%, driven primarily by the improving credit
environment. Decreases in revenues driven by lower gains on asset sales were
mostly offset by decreased expenses due to lower volumes and divestitures.
Revenues decreased 11% from the prior year, driven primarily by portfolio
run off, divestitures and asset sales. Net interest revenue increased 6% due to
the adoption of SFAS 166/167, partially offset by the impact of lower balances
due to portfolio run-off and asset sales. Non-interest revenue declined 58%,
primarily due to the absence of the $1.1 billion gain on the sale of Redecard
in the first quarter of 2009 and a higher mortgage repurchase reserve charge.
Expenses decreased 19%, primarily due to the impact of divestitures, lower
volumes, re-engineering actions and the absence of costs associated with
the U.S. government loss-sharing agreement, which was exited in the fourth
quarter of 2009.
Provisions decreased 38%, reflecting a net $1.8 billion loan loss reserve
release in 2010 compared to a $5.8 billion build in 2009. Lower net credit
losses across most businesses were partially offset by the impact of the
adoption of SFAS 166/167. On a comparable basis, net credit losses were
lower year-over-year by 28%, driven by improvement in U.S. mortgages,
international portfolios and retail partner cards.
Assets declined 21% from the prior year, primarily driven by portfolio
run-off, higher loan loss reserve balances, and the impact of asset sales and
divestitures, partially offset by an increase of $41 billion resulting from the
adoption of SFAS 166/167. Key divestitures in 2010 included The Student
Loan Corporation, Primerica, auto loans, the Canadian Mastercard business
and U.S. retail sales finance portfolios.
Japan Consumer Finance
Citi continues to actively monitor a number of matters involving its Japan
Consumer Finance business, including customer defaults, refund claims and
litigation, as well as financial and legislative, regulatory, judicial and other
political developments, relating to the charging of gray zone interest. Gray zone
interest represents interest at rates that are legal but for which claims may not be
enforceable. In 2008, Citi decided to exit its Japan Consumer Finance business
and has been liquidating its portfolio and otherwise winding down the business
since such time. However, this business has incurred, and will continue to face,
net credit losses and refunds, due in part to legislative, regulatory and judicial
actions taken in recent years. These actions may also reduce credit availability
and increase potential claims and losses relating to gray zone interest.
In September 2010, one of Japan’s largest consumer finance companies
(Takefuji) declared bankruptcy, reflecting the financial distress that Japan’s
top consumer finance lenders are facing as they continue to deal with
liabilities for gray zone interest refund claims. The publicity relating to
Takefuji’s bankruptcy resulted in a significant increase in the number of
refund claims during the latter part of 2010 and first half of 2011, although
Citi observed a steady decline in such claims during the remainder of 2011.
During 2011, LCL recorded a net increase in its reserves related to customer
refunds in the Japan Consumer Finance business of approximately $120
million (pretax), in addition to an increase of approximately $325 million
(pretax) in 2010.
As evidenced by the events described above, the trend in the type, number
and amount of refund claims remains volatile, and the potential full amount
of losses and their impact on Citi is subject to significant uncertainties
and continues to be difficult to predict. In addition, regulators in Japan
have stated that they are considering legislation to establish a framework
for collective legal action proceedings. If such legislation is passed and
implemented, it could potentially introduce a more accessible procedure for
current and former customers to pursue refund claims and other types of
collective actions. Citi continues to monitor and evaluate these developments
and the potential impact to both currently and previously outstanding loans
in this business and its reserves related thereto.