Citibank 2011 Annual Report Download - page 36
Download and view the complete annual report
Please find page 36 of the 2011 Citibank annual report below. You can navigate through the pages in the report by either clicking on the pages listed below, or by using the keyword search tool below to find specific information within the annual report.-
 1
1 -
2
-
3
-
4
-
5
-
6
-
7
-
8
-
9
-
10
-
11
-
12
-
13
-
14
-
15
-
16
-
17
-
18
-
19
-
20
-
21
-
22
-
23
-
24
-
25
-
 26
26 -
 27
27 -
 28
28 -
 29
29 -
 30
30 -
 31
31 -
 32
32 -
 33
33 -
 34
34 -
 35
35 -
 36
36 -
 37
37 -
 38
38 -
 39
39 -
 40
40 -
 41
41 -
 42
42 -
 43
43 -
 44
44 -
 45
45 -
 46
46 -
47
-
48
-
49
-
50
-
51
-
52
-
53
-
54
-
55
-
56
-
57
-
58
-
59
-
60
-
61
-
62
-
63
-
64
-
65
-
66
-
67
-
68
-
69
-
70
-
71
-
72
-
73
-
74
-
75
-
76
-
77
-
78
-
79
-
80
-
81
-
82
-
83
-
84
-
85
-
86
-
87
-
88
-
89
-
90
-
91
-
92
-
93
-
94
-
95
-
96
-
97
-
98
-
99
-
100
-
101
-
102
-
103
-
104
-
105
-
106
-
107
-
108
-
109
-
110
-
111
-
112
-
113
-
114
-
115
-
116
-
117
-
118
-
119
-
120
-
121
-
122
-
123
-
124
-
125
-
126
-
127
-
128
-
129
-
130
-
131
-
132
-
133
-
134
-
135
-
136
-
137
-
138
-
139
-
140
-
141
-
142
-
143
-
144
-
145
-
146
-
147
-
148
-
149
-
150
-
151
-
152
-
153
-
154
-
155
-
156
-
157
-
158
-
159
-
160
-
161
-
162
-
163
-
164
-
165
-
166
-
167
-
168
-
169
-
170
-
171
-
172
-
173
-
174
-
175
-
176
-
177
-
178
-
179
-
180
-
181
-
182
-
183
-
184
-
185
-
186
-
187
-
188
-
189
-
190
-
191
-
192
-
193
-
194
-
195
-
196
-
197
-
198
-
199
-
200
-
201
-
202
-
203
-
204
-
205
-
206
-
207
-
208
-
209
-
210
-
211
-
212
-
213
-
214
-
215
-
216
-
217
-
218
-
219
-
220
-
221
-
222
-
223
-
224
-
225
-
226
-
227
-
228
-
229
-
230
-
231
-
232
-
233
-
234
-
235
-
236
-
237
-
238
-
239
-
240
-
241
-
242
-
243
-
244
-
245
-
246
-
247
-
248
-
249
-
250
-
251
-
252
-
253
-
254
-
255
-
256
-
257
-
258
-
259
-
260
-
261
-
262
-
263
-
264
-
265
-
266
-
267
-
268
-
269
-
270
-
271
-
272
-
273
-
274
-
275
-
276
-
277
-
278
-
279
-
280
-
281
-
282
-
283
-
284
-
285
-
286
-
287
-
288
-
289
-
290
-
291
-
292
-
293
-
294
-
295
-
296
-
297
-
298
-
299
-
300
-
301
-
302
-
303
-
304
-
305
-
306
-
307
-
308
-
309
-
310
-
311
-
312
-
313
-
314
-
315
-
316
-
317
-
318
-
319
-
320
 |
 |

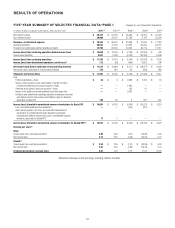
14
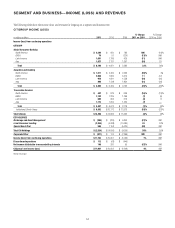
CITICORP
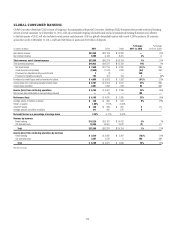
Citicorp is Citigroup’s global bank for consumers and businesses and represents Citi’s core franchises. Citicorp is focused on providing best-in-class products
and services to customers and leveraging Citigroup’s unparalleled global network. Citicorp is physically present in approximately 100 countries, many for
over 100 years, and offers services in over 160 countries and jurisdictions. Citi believes this global network provides a strong foundation for servicing the broad
financial services needs of large multinational clients and for meeting the needs of retail, private banking, commercial, public sector and institutional clients
around the world. Citigroup’s global footprint provides coverage of the world’s emerging economies, which Citi continues to believe represent a strong area of
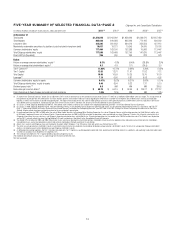
growth. At December 31, 2011, Citicorp had approximately $1.3 trillion of assets and $797 billion of deposits, representing approximately 70% of Citi’s total
assets and approximately 92% of its deposits.
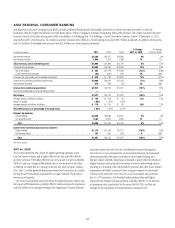
At December 31, 2011, Citicorp consisted of the following businesses: Global Consumer Banking (which included retail banking and Citi-branded cards in four
regions—North America, EMEA, Latin America and Asia) and Institutional Clients Group (which included Securities and Banking and Transaction Services).
In millions of dollars 2011
% Change
2011 vs. 2010
æ#HANGEæ
æVSæ
.ETæINTERESTæREVENUE $38,135 (1)%
.ONINTERESTæREVENUE 26,436 (2)
Total revenues, net of interest expense $64,571 (2)%
Provisions for credit losses and for benefits and claims
.ETæCREDITæLOSSES $ 8,307 æ (30)%
#REDITæRESERVEæBUILDæRELEASE (3,544) (64) .-
0ROVISIONæFORæLOANæLOSSES $ 4,763 æ æ (50)%
0ROVISIONæFORæBENEFITSæANDæCLAIMS 152 1
0ROVISIONæFORæUNFUNDEDæLENDINGæCOMMITMENTS 92 NM .-
4OTALæPROVISIONSæFORæCREDITæLOSSESæANDæFORæBENEFITSæANDæCLAIMS $ 5,007 æ æ (49)%
Total operating expenses $39,620 10%
Income from continuing operations before taxes $19,944 1%
0ROVISIONSæFORæINCOMEæTAXES 5,446 12
Income from continuing operations $14,498 (2)%
.ETæINCOMEæATTRIBUTABLEæTOæNONCONTROLLINGæINTERESTS 56 (54)
Citicorp’s net income $14,442 (2)%
Balance sheet data (in billions of dollars)
Total EOP assets $ 1,319 æ 3%
Average assets $ 1,358 æ æ 8%
Total EOP deposits 797 æææ æææ 5
.-æ.OTæMEANINGFUL