Citibank 2011 Annual Report Download - page 22
Download and view the complete annual report
Please find page 22 of the 2011 Citibank annual report below. You can navigate through the pages in the report by either clicking on the pages listed below, or by using the keyword search tool below to find specific information within the annual report.-
 1
1 -
2
-
3
-
4
-
5
-
6
-
7
-
8
-
9
-
10
-
11
-
 12
12 -
 13
13 -
 14
14 -
 15
15 -
 16
16 -
 17
17 -
 18
18 -
 19
19 -
 20
20 -
 21
21 -
 22
22 -
 23
23 -
 24
24 -
 25
25 -
 26
26 -
 27
27 -
 28
28 -
 29
29 -
 30
30 -
 31
31 -
 32
32 -
33
-
34
-
35
-
36
-
37
-
38
-
39
-
40
-
41
-
42
-
43
-
44
-
45
-
46
-
47
-
48
-
49
-
50
-
51
-
52
-
53
-
54
-
55
-
56
-
57
-
58
-
59
-
60
-
61
-
62
-
63
-
64
-
65
-
66
-
67
-
68
-
69
-
70
-
71
-
72
-
73
-
74
-
75
-
76
-
77
-
78
-
79
-
80
-
81
-
82
-
83
-
84
-
85
-
86
-
87
-
88
-
89
-
90
-
91
-
92
-
93
-
94
-
95
-
96
-
97
-
98
-
99
-
100
-
101
-
102
-
103
-
104
-
105
-
106
-
107
-
108
-
109
-
110
-
111
-
112
-
113
-
114
-
115
-
116
-
117
-
118
-
119
-
120
-
121
-
122
-
123
-
124
-
125
-
126
-
127
-
128
-
129
-
130
-
131
-
132
-
133
-
134
-
135
-
136
-
137
-
138
-
139
-
140
-
141
-
142
-
143
-
144
-
145
-
146
-
147
-
148
-
149
-
150
-
151
-
152
-
153
-
154
-
155
-
156
-
157
-
158
-
159
-
160
-
161
-
162
-
163
-
164
-
165
-
166
-
167
-
168
-
169
-
170
-
171
-
172
-
173
-
174
-
175
-
176
-
177
-
178
-
179
-
180
-
181
-
182
-
183
-
184
-
185
-
186
-
187
-
188
-
189
-
190
-
191
-
192
-
193
-
194
-
195
-
196
-
197
-
198
-
199
-
200
-
201
-
202
-
203
-
204
-
205
-
206
-
207
-
208
-
209
-
210
-
211
-
212
-
213
-
214
-
215
-
216
-
217
-
218
-
219
-
220
-
221
-
222
-
223
-
224
-
225
-
226
-
227
-
228
-
229
-
230
-
231
-
232
-
233
-
234
-
235
-
236
-
237
-
238
-
239
-
240
-
241
-
242
-
243
-
244
-
245
-
246
-
247
-
248
-
249
-
250
-
251
-
252
-
253
-
254
-
255
-
256
-
257
-
258
-
259
-
260
-
261
-
262
-
263
-
264
-
265
-
266
-
267
-
268
-
269
-
270
-
271
-
272
-
273
-
274
-
275
-
276
-
277
-
278
-
279
-
280
-
281
-
282
-
283
-
284
-
285
-
286
-
287
-
288
-
289
-
290
-
291
-
292
-
293
-
294
-
295
-
296
-
297
-
298
-
299
-
300
-
301
-
302
-
303
-
304
-
305
-
306
-
307
-
308
-
309
-
310
-
311
-
312
-
313
-
314
-
315
-
316
-
317
-
318
-
319
-
320
 |
 |

20
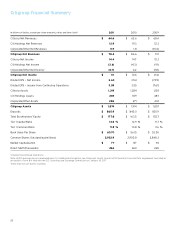
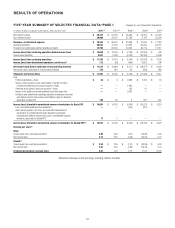
Citigroup Financial Summary
In billions of dollars, except per-share amounts, ratios and direct staff 2011 2010 2009
Citicorp Net Revenues $ 64.6 $ 65.6 $ 68.4
Citi Holdings Net Revenues 12.9 19.3 33.3
Corporate/Other Net Revenues 0.9 1.8 (10.6)
Citigroup Net Revenues $ 78.4 $ 86.6 $ 91.1
Citicorp Net Income 14.4 14.7 15.3
Citi Holdings Net Income (2.6) (4.3) (9.1)
Corporate/Other Net Income1(0.7) 0.2 (7.8)
Citigroup Net Income $ 11.1 $ 10.6 $ (1.6)
Diluted EPS — Net Income 3.63 3.54 (7.99)
Diluted EPS — Income from Continuing Operations 3.59 3.55 (7.61)
Citicorp Assets 1,319 1,284 1,138
Citi Holdings Assets 269 359 487
Corporate/Other Assets 286 271 232
Citigroup Assets $ 1,874 $ 1,914 $ 1,857
Deposits $ 865.9 $ 845.0 $ 835.9
Total Stockholders’ Equity $ 177.8 $ 163.5 $ 152.7
Tier 1 Capital Ratio 13.6 % 12.9 % 11.7 %
Tier 1 Common Ratio 11.8 % 10.8 % 9.6 %
Book Value Per Share $ 60.70 $ 56.15 $ 53.50
Common Shares Outstanding (millions) 2,923.9 2,905.8 2,848.3
Market Capitalization $ 77 $ 137 $ 94
Direct Staff (thousands) 266 260 265
1Includes Discontinued Operations.
Note: 2009 revenues are on a managed basis. For additional information, see Citigroup’s Fourth Quarter 2010 Quarterly Financial Data Supplement furnished as
an exhibit to Form 8-K filed with the U.S. Securities and Exchange Commission on January 18, 2011.
Totals may not sum due to rounding.