Citibank 2011 Annual Report Download - page 116
Download and view the complete annual report
Please find page 116 of the 2011 Citibank annual report below. You can navigate through the pages in the report by either clicking on the pages listed below, or by using the keyword search tool below to find specific information within the annual report.-
 1
1 -
2
-
3
-
4
-
5
-
6
-
7
-
8
-
9
-
10
-
11
-
12
-
13
-
14
-
15
-
16
-
17
-
18
-
19
-
20
-
21
-
22
-
23
-
24
-
25
-
26
-
27
-
28
-
29
-
30
-
31
-
32
-
33
-
34
-
35
-
36
-
37
-
38
-
39
-
40
-
41
-
42
-
43
-
44
-
45
-
46
-
47
-
48
-
49
-
50
-
51
-
52
-
53
-
54
-
55
-
56
-
57
-
58
-
59
-
60
-
61
-
62
-
63
-
64
-
65
-
66
-
67
-
68
-
69
-
70
-
71
-
72
-
73
-
74
-
75
-
76
-
77
-
78
-
79
-
80
-
81
-
82
-
83
-
84
-
85
-
86
-
87
-
88
-
89
-
90
-
91
-
92
-
93
-
94
-
95
-
96
-
97
-
98
-
99
-
100
-
101
-
102
-
103
-
104
-
105
-
 106
106 -
 107
107 -
 108
108 -
 109
109 -
 110
110 -
 111
111 -
 112
112 -
 113
113 -
 114
114 -
 115
115 -
 116
116 -
 117
117 -
 118
118 -
 119
119 -
 120
120 -
 121
121 -
 122
122 -
 123
123 -
 124
124 -
 125
125 -
 126
126 -
127
-
128
-
129
-
130
-
131
-
132
-
133
-
134
-
135
-
136
-
137
-
138
-
139
-
140
-
141
-
142
-
143
-
144
-
145
-
146
-
147
-
148
-
149
-
150
-
151
-
152
-
153
-
154
-
155
-
156
-
157
-
158
-
159
-
160
-
161
-
162
-
163
-
164
-
165
-
166
-
167
-
168
-
169
-
170
-
171
-
172
-
173
-
174
-
175
-
176
-
177
-
178
-
179
-
180
-
181
-
182
-
183
-
184
-
185
-
186
-
187
-
188
-
189
-
190
-
191
-
192
-
193
-
194
-
195
-
196
-
197
-
198
-
199
-
200
-
201
-
202
-
203
-
204
-
205
-
206
-
207
-
208
-
209
-
210
-
211
-
212
-
213
-
214
-
215
-
216
-
217
-
218
-
219
-
220
-
221
-
222
-
223
-
224
-
225
-
226
-
227
-
228
-
229
-
230
-
231
-
232
-
233
-
234
-
235
-
236
-
237
-
238
-
239
-
240
-
241
-
242
-
243
-
244
-
245
-
246
-
247
-
248
-
249
-
250
-
251
-
252
-
253
-
254
-
255
-
256
-
257
-
258
-
259
-
260
-
261
-
262
-
263
-
264
-
265
-
266
-
267
-
268
-
269
-
270
-
271
-
272
-
273
-
274
-
275
-
276
-
277
-
278
-
279
-
280
-
281
-
282
-
283
-
284
-
285
-
286
-
287
-
288
-
289
-
290
-
291
-
292
-
293
-
294
-
295
-
296
-
297
-
298
-
299
-
300
-
301
-
302
-
303
-
304
-
305
-
306
-
307
-
308
-
309
-
310
-
311
-
312
-
313
-
314
-
315
-
316
-
317
-
318
-
319
-
320
 |
 |

94
EXPOSURE TO COMMERCIAL REAL ESTATE
ICG and the SAP, through their business activities and as capital markets
participants, incur exposures that are directly or indirectly tied to the
commercial real estate (CRE) market, and each of LCL and GCB hold loans
that are collateralized by CRE. These exposures are represented primarily by
the following three categories:
(1) Assets held at fair value included approximately $5.5 billion at
December 31, 2011, of which approximately $4.0 billion are securities,
loans and other items linked to CRE that are carried at fair value as
Trading account assets, approximately $1.1 billion are securities backed
by CRE carried at fair value as available-for-sale (AFS) investments,
and approximately $0.4 billion are other exposures classified as Other
assets. Changes in fair value for these trading account assets are reported
in current earnings, while for AFS investments change in fair value are
reported in Accumulated other comprehensive income with credit-related
other-than-temporary impairments reported in current earnings.
The majority of these exposures are classified as Level 3 in the fair value
hierarchy. Over the last several years, weakened activity in the trading
markets for some of these instruments resulted in reduced liquidity, thereby
decreasing the observable inputs for such valuations, and could continue to
have an adverse impact on how these instruments are valued in the future.
See Note 25 to the Consolidated Financial Statements.
(2) Assets held at amortized cost include approximately $1.2 billion
of securities classified as held-to-maturity (HTM) and approximately
$26.2 billion of loans and commitments each as of December 31, 2011.
HTM securities are accounted for at amortized cost, subject to an other-than-
temporary impairment evaluation. Loans and commitments are recorded at
amortized cost. The impact of changes in credit is reflected in the calculation
of the allowance for loan losses and in net credit losses.
(3) Equity and other investments include approximately $3.6 billion of
equity and other investments (such as limited partner fund investments) at
December 31, 2011 that are accounted for under the equity method, which
recognizes gains or losses based on the investor’s share of the net income
(loss) of the investee.
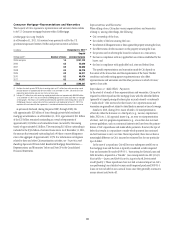
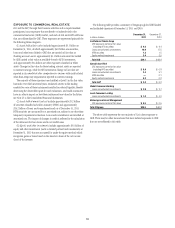
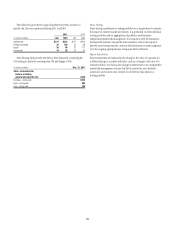
The following table provides a summary of Citigroup’s global CRE funded
and unfunded exposures at December 31, 2011 and 2010:
In billions of dollars
December 31,
2011
$ECEMBERææ
æ
Institutional Clients Group
#2%æEXPOSURESæCARRIEDæATæFAIRæVALUEææ
INCLUDINGæ!&3æSECURITIES $ 4.6
,OANSæANDæUNFUNDEDæCOMMITMENTS 19.9
(4-æSECURITIES 1.2
%QUITYæMETHODæINVESTMENTS 3.4
Total ICG $29.1
Special Asset Pool
#2%æEXPOSURESæCARRIEDæATæFAIRæVALUEææ
INCLUDINGæ!&3æSECURITIES $ 0.4
,OANSæANDæUNFUNDEDæCOMMITMENTS 2.4
(4-æSECURITIES —
%QUITYæMETHODæINVESTMENTS 0.2
Total SAP $ 3.0
Global Consumer Banking
,OANSæANDæUNFUNDEDæCOMMITMENTS $ 2.9
Local Consumer Lending
,OANSæANDæUNFUNDEDæCOMMITMENTS $ 1.0
Brokerage and Asset Management
#2%æEXPOSURESæCARRIEDæATæFAIRæVALUEæ $ 0.5
Total Citigroup $36.5
The above table represents the vast majority of Citi’s direct exposure to
CRE. There may be other transactions that have indirect exposures to CRE
that are not reflected in this table.