Citibank 2011 Annual Report Download - page 40
Download and view the complete annual report
Please find page 40 of the 2011 Citibank annual report below. You can navigate through the pages in the report by either clicking on the pages listed below, or by using the keyword search tool below to find specific information within the annual report.-
 1
1 -
2
-
3
-
4
-
5
-
6
-
7
-
8
-
9
-
10
-
11
-
12
-
13
-
14
-
15
-
16
-
17
-
18
-
19
-
20
-
21
-
22
-
23
-
24
-
25
-
26
-
27
-
28
-
29
-
 30
30 -
 31
31 -
 32
32 -
 33
33 -
 34
34 -
 35
35 -
 36
36 -
 37
37 -
 38
38 -
 39
39 -
 40
40 -
 41
41 -
 42
42 -
 43
43 -
 44
44 -
 45
45 -
 46
46 -
 47
47 -
 48
48 -
 49
49 -
 50
50 -
51
-
52
-
53
-
54
-
55
-
56
-
57
-
58
-
59
-
60
-
61
-
62
-
63
-
64
-
65
-
66
-
67
-
68
-
69
-
70
-
71
-
72
-
73
-
74
-
75
-
76
-
77
-
78
-
79
-
80
-
81
-
82
-
83
-
84
-
85
-
86
-
87
-
88
-
89
-
90
-
91
-
92
-
93
-
94
-
95
-
96
-
97
-
98
-
99
-
100
-
101
-
102
-
103
-
104
-
105
-
106
-
107
-
108
-
109
-
110
-
111
-
112
-
113
-
114
-
115
-
116
-
117
-
118
-
119
-
120
-
121
-
122
-
123
-
124
-
125
-
126
-
127
-
128
-
129
-
130
-
131
-
132
-
133
-
134
-
135
-
136
-
137
-
138
-
139
-
140
-
141
-
142
-
143
-
144
-
145
-
146
-
147
-
148
-
149
-
150
-
151
-
152
-
153
-
154
-
155
-
156
-
157
-
158
-
159
-
160
-
161
-
162
-
163
-
164
-
165
-
166
-
167
-
168
-
169
-
170
-
171
-
172
-
173
-
174
-
175
-
176
-
177
-
178
-
179
-
180
-
181
-
182
-
183
-
184
-
185
-
186
-
187
-
188
-
189
-
190
-
191
-
192
-
193
-
194
-
195
-
196
-
197
-
198
-
199
-
200
-
201
-
202
-
203
-
204
-
205
-
206
-
207
-
208
-
209
-
210
-
211
-
212
-
213
-
214
-
215
-
216
-
217
-
218
-
219
-
220
-
221
-
222
-
223
-
224
-
225
-
226
-
227
-
228
-
229
-
230
-
231
-
232
-
233
-
234
-
235
-
236
-
237
-
238
-
239
-
240
-
241
-
242
-
243
-
244
-
245
-
246
-
247
-
248
-
249
-
250
-
251
-
252
-
253
-
254
-
255
-
256
-
257
-
258
-
259
-
260
-
261
-
262
-
263
-
264
-
265
-
266
-
267
-
268
-
269
-
270
-
271
-
272
-
273
-
274
-
275
-
276
-
277
-
278
-
279
-
280
-
281
-
282
-
283
-
284
-
285
-
286
-
287
-
288
-
289
-
290
-
291
-
292
-
293
-
294
-
295
-
296
-
297
-
298
-
299
-
300
-
301
-
302
-
303
-
304
-
305
-
306
-
307
-
308
-
309
-
310
-
311
-
312
-
313
-
314
-
315
-
316
-
317
-
318
-
319
-
320
 |
 |

18
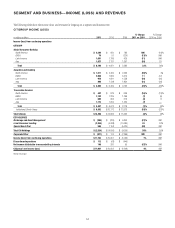
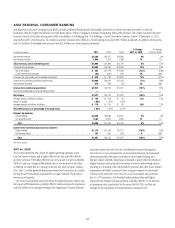
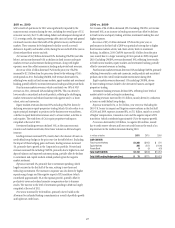
EMEA REGIONAL CONSUMER BANKING
EMEA Regional Consumer Banking (EMEA RCB) provides traditional banking and Citi-branded card services to retail customers and small to mid-size
businesses, primarily in Central and Eastern Europe, the Middle East and Africa (remaining retail banking and cards activities in Western Europe are included
in Citi Holdings). The countries in which EMEA RCB has the largest presence are Poland, Turkey, Russia and the United Arab Emirates. At December 31, 2011,
EMEA RCB had 292 retail bank branches with 3.7 million customer accounts, $4.2 billion in retail banking loans and $9.5 billion in deposits. In addition, the
business had 2.6 million Citi-branded card accounts with $2.7 billion in outstanding card loan balances.
In millions of dollars 2011
% Change
2011 vs. 2010
æ#HANGEæ
æVSæ
.ETæINTERESTæREVENUE $ 893 (3)%
.ONINTERESTæREVENUE 586 1
Total revenues, net of interest expense $ 1,479 (2)%
4OTALæOPERATINGæEXPENSES $ 1,287 9%
.ETæCREDITæLOSSES $ 172 (46)%
0ROVISIONæFORæUNFUNDEDæLENDINGæCOMMITMENTS 3 NM
#REDITæRESERVEæBUILDæRELEASE (118) —.-
0ROVISIONSæFORæLOANæLOSSESæ $57 (71)%
)NCOMEæLOSSæFROMæCONTINUINGæOPERATIONSæBEFOREæTAXES $ 135 4% .-
)NCOMEæTAXESæBENEFITS 56 44 .-
Income (loss) from continuing operations $ 79 (13)% .-
.ETæINCOMEæLOSSæATTRIBUTABLEæTOæNONCONTROLLINGæINTERESTS — 100
Net income (loss) $ 79 (14)% .-
!VERAGEæASSETSæ(in billions of dollars) $10 —
2ETURNæONæASSETS 0.79%
!VERAGEæDEPOSITSæ(in billions of dollars) $10 11
Net credit losses as a percentage of average loans 2.38%
Revenue by business
2ETAILæBANKING $ 811 (1)%
#ITIBRANDEDæCARDS 668 (2)
Total $ 1,479 (2)%
Income (loss) from continuing operations by business
2ETAILæBANKING $ (56) (4)%
#ITIBRANDEDæCARDS 135 (7) .-
Total $ 79 (13)% .-
.-æ .OTæMEANINGFUL
2011 vs. 2010
Net income declined 14% as compared to the prior year as an improvement
in net credit losses was partially offset by lower revenues and higher
expenses from increased investment spending. During 2011, the U.S. dollar
generally depreciated versus local currencies. As a result, the impact of FX
translation accounted for an approximately 1% growth in revenues and
expenses, respectively.
Revenues declined 2% driven by the continued liquidation of higher
yielding non-strategic customer portfolios and a lower contribution from
Akbank, Citi’s equity investment in Turkey. The revenue decline was partly
offset by the impact of FX translation and improved underlying trends in the
core lending portfolio, discussed below.
Net interest revenue declined 3% due to the continued decline in
the higher yielding non-strategic retail banking portfolio and spread
compression in the Citi-branded cards portfolio. Interest rate caps on credit
cards, particularly in Turkey and Poland, contributed to the lower spreads in
the cards portfolio.
Non-interest revenue increased 1%, reflecting higher investment
sales and cards fees, partly offset by the lower contribution from Akbank.
Underlying drivers continued to show growth as investment sales grew 28%
from the prior year and cards purchase sales grew 14%.
Expenses increased 9%, due to the impact of FX translation, investment
spending and higher transactional expenses, partly offset by continued
savings initiatives. Expenses could remain at elevated levels in 2012 given
continued investment spending.
Provisions were 71% lower than the prior year driven by a reduction in
net credit losses. Net credit losses decreased 46%, reflecting the continued
credit quality improvement during the year, stricter underwriting criteria and
the move to lower risk products. Loan loss reserve releases were flat. Assuming
the underlying core portfolio continues to grow and season in 2012, Citi
expects credit costs to rise.