Citibank 2011 Annual Report Download - page 191
Download and view the complete annual report
Please find page 191 of the 2011 Citibank annual report below. You can navigate through the pages in the report by either clicking on the pages listed below, or by using the keyword search tool below to find specific information within the annual report.-
 1
1 -
2
-
3
-
4
-
5
-
6
-
7
-
8
-
9
-
10
-
11
-
12
-
13
-
14
-
15
-
16
-
17
-
18
-
19
-
20
-
21
-
22
-
23
-
24
-
25
-
26
-
27
-
28
-
29
-
30
-
31
-
32
-
33
-
34
-
35
-
36
-
37
-
38
-
39
-
40
-
41
-
42
-
43
-
44
-
45
-
46
-
47
-
48
-
49
-
50
-
51
-
52
-
53
-
54
-
55
-
56
-
57
-
58
-
59
-
60
-
61
-
62
-
63
-
64
-
65
-
66
-
67
-
68
-
69
-
70
-
71
-
72
-
73
-
74
-
75
-
76
-
77
-
78
-
79
-
80
-
81
-
82
-
83
-
84
-
85
-
86
-
87
-
88
-
89
-
90
-
91
-
92
-
93
-
94
-
95
-
96
-
97
-
98
-
99
-
100
-
101
-
102
-
103
-
104
-
105
-
106
-
107
-
108
-
109
-
110
-
111
-
112
-
113
-
114
-
115
-
116
-
117
-
118
-
119
-
120
-
121
-
122
-
123
-
124
-
125
-
126
-
127
-
128
-
129
-
130
-
131
-
132
-
133
-
134
-
135
-
136
-
137
-
138
-
139
-
140
-
141
-
142
-
143
-
144
-
145
-
146
-
147
-
148
-
149
-
150
-
151
-
152
-
153
-
154
-
155
-
156
-
157
-
158
-
159
-
160
-
161
-
162
-
163
-
164
-
165
-
166
-
167
-
168
-
169
-
170
-
171
-
172
-
173
-
174
-
175
-
176
-
177
-
178
-
179
-
180
-
 181
181 -
 182
182 -
 183
183 -
 184
184 -
 185
185 -
 186
186 -
 187
187 -
 188
188 -
 189
189 -
 190
190 -
 191
191 -
 192
192 -
 193
193 -
 194
194 -
 195
195 -
 196
196 -
 197
197 -
 198
198 -
 199
199 -
 200
200 -
 201
201 -
202
-
203
-
204
-
205
-
206
-
207
-
208
-
209
-
210
-
211
-
212
-
213
-
214
-
215
-
216
-
217
-
218
-
219
-
220
-
221
-
222
-
223
-
224
-
225
-
226
-
227
-
228
-
229
-
230
-
231
-
232
-
233
-
234
-
235
-
236
-
237
-
238
-
239
-
240
-
241
-
242
-
243
-
244
-
245
-
246
-
247
-
248
-
249
-
250
-
251
-
252
-
253
-
254
-
255
-
256
-
257
-
258
-
259
-
260
-
261
-
262
-
263
-
264
-
265
-
266
-
267
-
268
-
269
-
270
-
271
-
272
-
273
-
274
-
275
-
276
-
277
-
278
-
279
-
280
-
281
-
282
-
283
-
284
-
285
-
286
-
287
-
288
-
289
-
290
-
291
-
292
-
293
-
294
-
295
-
296
-
297
-
298
-
299
-
300
-
301
-
302
-
303
-
304
-
305
-
306
-
307
-
308
-
309
-
310
-
311
-
312
-
313
-
314
-
315
-
316
-
317
-
318
-
319
-
320
 |
 |

169
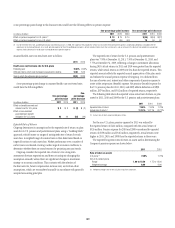
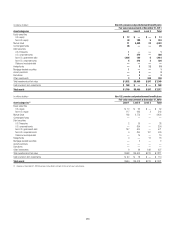
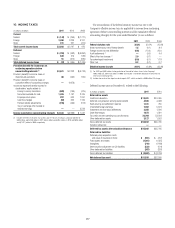
A one-percentage-point change in the discount rates would have the following effects on pension expense:
One-percentage-point increase One-percentage-point decrease
In millions of dollars 2011 2011
%FFECTæONæPENSIONæEXPENSEæFORæ53æPLANSæ $19 $ (34)
%FFECTæONæPENSIONæEXPENSEæFORæNON53æPLANS (57) 70
æ $UEæTOæTHEæFREEZEæOFæTHEæ53æQUALIFIEDæPENSIONæPLANæCOMMENCINGæ*ANUARYæææTHEæMAJORITYæOFæTHEæPROSPECTIVEæSERVICEæCOSTæHASæBEENæELIMINATEDæANDæTHEæGAINLOSSæAMORTIZATIONæPERIODæWASæCHANGEDæTOæTHEæLIFEæ
EXPECTANCYæFORæINACTIVEæPARTICIPANTSæ!SæAæRESULTæPENSIONæEXPENSEæFORæTHEæ53æQUALIFIEDæPENSIONæPLANæISæDRIVENæMOREæBYæINTERESTæCOSTSæTHANæSERVICEæCOSTSæANDæANæINCREASEæINæTHEæDISCOUNTæRATEæWOULDæINCREASEæPENSIONæ
EXPENSEæWHILEæAæDECREASEæINæTHEæDISCOUNTæRATEæWOULDæDECREASEæPENSIONæEXPENSE
Assumed health-care cost-trend rates were as follows:
2011
Health-care cost increase rate for U.S. plans
&OLLOWINGæYEAR 9.00%
5LTIMATEæRATEæTOæWHICHæCOSTæINCREASEæISæASSUMEDæTOæDECLINE 5.00
9EARæINæWHICHæTHEæULTIMATEæRATEæISæREACHED 2020
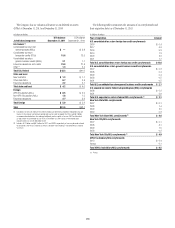
A one-percentage-point change in assumed health-care cost-trend rates
would have the following effects:
One-percentage-
point increase
One-
percentage-
point decrease
In millions of dollars 2011 2011
%FFECTæONæBENEFITSæEARNEDæANDæ
INTERESTæCOSTæFORæ53æPLANS $2 $ (2)
%FFECTæONæACCUMULATEDæ
POSTRETIREMENTæBENEFITæ
OBLIGATIONæFORæ53æPLANS 43 (38)
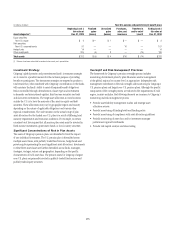
Expected Rate of Return
Citigroup determines its assumptions for the expected rate of return on plan
assets for its U.S. pension and postretirement plans using a “building block”
approach, which focuses on ranges of anticipated rates of return for each
asset class. A weighted range of nominal rates is then determined based on
target allocations to each asset class. Market performance over a number of
earlier years is evaluated covering a wide range of economic conditions to
determine whether there are sound reasons for projecting any past trends.
Citigroup considers the expected rate of return to be a long-term
assessment of return expectations and does not anticipate changing this
assumption annually unless there are significant changes in investment
strategy or economic conditions. This contrasts with the selection of
the discount rate, future compensation increase rate, and certain other
assumptions, which are reconsidered annually in accordance with generally
accepted accounting principles.
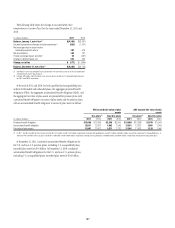
The expected rate of return for the U.S. pension and postretirement
plans was 7.50% at December 31, 2011, 7.50% at December 31, 2010, and
7.75% at December 31, 2009, reflecting a change in investment allocations
during 2010. Actual returns in 2011 and 2010 were greater than the expected
returns, while actual returns in 2009 were less than the expected returns. This
expected amount reflects the expected annual appreciation of the plan assets
and reduces the annual pension expense of Citigroup. It is deducted from
the sum of service cost, interest and other components of pension expense to
arrive at the net pension (benefit) expense. Net pension (benefit) expense for
the U.S. pension plans for 2011, 2010, and 2009 reflects deductions of $890
million, $874 million, and $912 million of expected returns, respectively.
The following table shows the expected versus actual rate of return on plan
assets for 2011, 2010 and 2009 for the U.S. pension and postretirement plans:
2011
%XPECTEDæRATEæOFæRETURN 7.50%
!CTUALæRATEæOFæRETURNæ 11.13%
æ !CTUALæRATESæOFæRETURNæAREæPRESENTEDæGROSSæOFæFEES
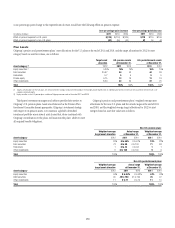
For the non-U.S. plans, pension expense for 2011 was reduced by
the expected return of $422 million, compared with the actual return of
$526 million. Pension expense for 2010 and 2009 was reduced by expected
returns of $378 million and $336 million, respectively. Actual returns were
higher in 2011, 2010, and 2009 than the expected returns in those years.
The expected long-term rates of return on assets used in determining the
Company’s pension expense are shown below:
2011
Rate of return on assets
53æPLANSæ 7.50%
.ON53æPENSIONæPLANS
2ANGE 1.00 to 12.50 æTOæ
7EIGHTEDæAVERAGE 6.89
æ 7EIGHTEDAVERAGEæRATESæFORæTHEæ53æPLANSæEQUALæTHEæSTATEDæRATES