Citibank 2011 Annual Report Download - page 263
Download and view the complete annual report
Please find page 263 of the 2011 Citibank annual report below. You can navigate through the pages in the report by either clicking on the pages listed below, or by using the keyword search tool below to find specific information within the annual report.-
 1
1 -
2
-
3
-
4
-
5
-
6
-
7
-
8
-
9
-
10
-
11
-
12
-
13
-
14
-
15
-
16
-
17
-
18
-
19
-
20
-
21
-
22
-
23
-
24
-
25
-
26
-
27
-
28
-
29
-
30
-
31
-
32
-
33
-
34
-
35
-
36
-
37
-
38
-
39
-
40
-
41
-
42
-
43
-
44
-
45
-
46
-
47
-
48
-
49
-
50
-
51
-
52
-
53
-
54
-
55
-
56
-
57
-
58
-
59
-
60
-
61
-
62
-
63
-
64
-
65
-
66
-
67
-
68
-
69
-
70
-
71
-
72
-
73
-
74
-
75
-
76
-
77
-
78
-
79
-
80
-
81
-
82
-
83
-
84
-
85
-
86
-
87
-
88
-
89
-
90
-
91
-
92
-
93
-
94
-
95
-
96
-
97
-
98
-
99
-
100
-
101
-
102
-
103
-
104
-
105
-
106
-
107
-
108
-
109
-
110
-
111
-
112
-
113
-
114
-
115
-
116
-
117
-
118
-
119
-
120
-
121
-
122
-
123
-
124
-
125
-
126
-
127
-
128
-
129
-
130
-
131
-
132
-
133
-
134
-
135
-
136
-
137
-
138
-
139
-
140
-
141
-
142
-
143
-
144
-
145
-
146
-
147
-
148
-
149
-
150
-
151
-
152
-
153
-
154
-
155
-
156
-
157
-
158
-
159
-
160
-
161
-
162
-
163
-
164
-
165
-
166
-
167
-
168
-
169
-
170
-
171
-
172
-
173
-
174
-
175
-
176
-
177
-
178
-
179
-
180
-
181
-
182
-
183
-
184
-
185
-
186
-
187
-
188
-
189
-
190
-
191
-
192
-
193
-
194
-
195
-
196
-
197
-
198
-
199
-
200
-
201
-
202
-
203
-
204
-
205
-
206
-
207
-
208
-
209
-
210
-
211
-
212
-
213
-
214
-
215
-
216
-
217
-
218
-
219
-
220
-
221
-
222
-
223
-
224
-
225
-
226
-
227
-
228
-
229
-
230
-
231
-
232
-
233
-
234
-
235
-
236
-
237
-
238
-
239
-
240
-
241
-
242
-
243
-
244
-
245
-
246
-
247
-
248
-
249
-
250
-
251
-
252
-
 253
253 -
 254
254 -
 255
255 -
 256
256 -
 257
257 -
 258
258 -
 259
259 -
 260
260 -
 261
261 -
 262
262 -
 263
263 -
 264
264 -
 265
265 -
 266
266 -
 267
267 -
 268
268 -
 269
269 -
 270
270 -
 271
271 -
 272
272 -
 273
273 -
274
-
275
-
276
-
277
-
278
-
279
-
280
-
281
-
282
-
283
-
284
-
285
-
286
-
287
-
288
-
289
-
290
-
291
-
292
-
293
-
294
-
295
-
296
-
297
-
298
-
299
-
300
-
301
-
302
-
303
-
304
-
305
-
306
-
307
-
308
-
309
-
310
-
311
-
312
-
313
-
314
-
315
-
316
-
317
-
318
-
319
-
320
 |
 |
241
24. CONCENTRATIONS OF CREDIT RISK
Concentrations of credit risk exist when changes in economic, industry or
geographic factors similarly affect groups of counterparties whose aggregate
credit exposure is material in relation to Citigroup’s total credit exposure.
Although Citigroup’s portfolio of financial instruments is broadly diversified
along industry, product, and geographic lines, material transactions are
completed with other financial institutions, particularly in the securities
trading, derivatives, and foreign exchange businesses.
In connection with the Company’s efforts to maintain a diversified
portfolio, the Company limits its exposure to any one geographic region,
country or individual creditor and monitors this exposure on a continuous
basis. At December 31, 2011, Citigroup’s most significant concentration of
credit risk was with the U.S. government and its agencies. The Company’s
exposure, which primarily results from trading assets and investments
issued by the U.S. government and its agencies, amounted to $177.9 billion
and $176.4 billion at December 31, 2011 and 2010, respectively. The
Japanese and Mexican governments and their agencies, which are
rated investment grade by both Moody’s and S&P, were the next largest
exposures. The Company’s exposure to Japan amounted to $33.2 billion
and $39.2 billion at December 31, 2011 and 2010, respectively, and was
composed of investment securities, loans and trading assets. The Company’s
exposure to Mexico amounted to $29.5 billion and $44.2 billion at
December 31, 2011 and 2010, respectively, and was composed of investment
securities, loans and trading assets.
The Company’s exposure to state and municipalities amounted
to $39.5 billion and $34.7 billion at December 31, 2011 and 2010,
respectively, and was composed of trading assets, investment securities,
derivatives and lending activities.
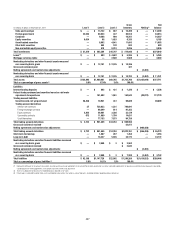
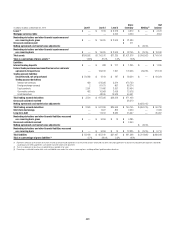
25. FAIR VALUE MEASUREMENT
ASC 820-10 (formerly SFAS 157) defines fair value, establishes a consistent
framework for measuring fair value and expands disclosure requirements
about fair value measurements. Fair value is defined as the price that
would be received to sell an asset or paid to transfer a liability in an orderly
transaction between market participants at the measurement date. Among
other things the standard requires the Company to maximize the use of
observable inputs and minimize the use of unobservable inputs when
measuring fair value. In addition, the use of block discounts is precluded
when measuring the fair value of instruments traded in an active market.
It also requires recognition of trade-date gains related to certain derivative
transactions whose fair values have been determined using unobservable
market inputs.
Under ASC 820-10, the probability of default of a counterparty is factored
into the valuation of derivative positions and includes the impact of
Citigroup’s own credit risk on derivatives and other liabilities measured at
fair value.
Fair Value Hierarchy
ASC 820-10, Fair Value Measurement, specifies a hierarchy of valuation
techniques based on whether the inputs to those valuation techniques are
observable or unobservable. Observable inputs reflect market data obtained
from independent sources, while unobservable inputs reflect the Company’s
market assumptions. These two types of inputs have created the following fair
value hierarchy:
identical instruments in active markets.
similar instruments in active markets; quoted
prices for identical or similar instruments in markets that are not
active; and model-derived valuations in which all significant inputs and
significant value drivers are observable in active markets.
more significant inputs or significant value drivers are unobservable.
This hierarchy requires the use of observable market data when available.
The Company considers relevant and observable market prices in its
valuations where possible. The frequency of transactions, the size of the bid-
ask spread and the amount of adjustment necessary when comparing similar
transactions are all factors in determining the liquidity of markets and the
relevance of observed prices in those markets.
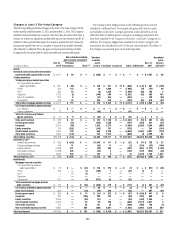
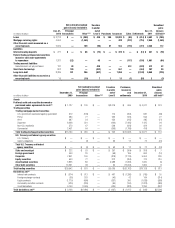
The Company’s policy with respect to transfers between levels of the fair
value hierarchy is to recognize transfers into and out of each level as of the
end of the reporting period.