Citibank 2011 Annual Report Download - page 276
Download and view the complete annual report
Please find page 276 of the 2011 Citibank annual report below. You can navigate through the pages in the report by either clicking on the pages listed below, or by using the keyword search tool below to find specific information within the annual report.-
 1
1 -
2
-
3
-
4
-
5
-
6
-
7
-
8
-
9
-
10
-
11
-
12
-
13
-
14
-
15
-
16
-
17
-
18
-
19
-
20
-
21
-
22
-
23
-
24
-
25
-
26
-
27
-
28
-
29
-
30
-
31
-
32
-
33
-
34
-
35
-
36
-
37
-
38
-
39
-
40
-
41
-
42
-
43
-
44
-
45
-
46
-
47
-
48
-
49
-
50
-
51
-
52
-
53
-
54
-
55
-
56
-
57
-
58
-
59
-
60
-
61
-
62
-
63
-
64
-
65
-
66
-
67
-
68
-
69
-
70
-
71
-
72
-
73
-
74
-
75
-
76
-
77
-
78
-
79
-
80
-
81
-
82
-
83
-
84
-
85
-
86
-
87
-
88
-
89
-
90
-
91
-
92
-
93
-
94
-
95
-
96
-
97
-
98
-
99
-
100
-
101
-
102
-
103
-
104
-
105
-
106
-
107
-
108
-
109
-
110
-
111
-
112
-
113
-
114
-
115
-
116
-
117
-
118
-
119
-
120
-
121
-
122
-
123
-
124
-
125
-
126
-
127
-
128
-
129
-
130
-
131
-
132
-
133
-
134
-
135
-
136
-
137
-
138
-
139
-
140
-
141
-
142
-
143
-
144
-
145
-
146
-
147
-
148
-
149
-
150
-
151
-
152
-
153
-
154
-
155
-
156
-
157
-
158
-
159
-
160
-
161
-
162
-
163
-
164
-
165
-
166
-
167
-
168
-
169
-
170
-
171
-
172
-
173
-
174
-
175
-
176
-
177
-
178
-
179
-
180
-
181
-
182
-
183
-
184
-
185
-
186
-
187
-
188
-
189
-
190
-
191
-
192
-
193
-
194
-
195
-
196
-
197
-
198
-
199
-
200
-
201
-
202
-
203
-
204
-
205
-
206
-
207
-
208
-
209
-
210
-
211
-
212
-
213
-
214
-
215
-
216
-
217
-
218
-
219
-
220
-
221
-
222
-
223
-
224
-
225
-
226
-
227
-
228
-
229
-
230
-
231
-
232
-
233
-
234
-
235
-
236
-
237
-
238
-
239
-
240
-
241
-
242
-
243
-
244
-
245
-
246
-
247
-
248
-
249
-
250
-
251
-
252
-
253
-
254
-
255
-
256
-
257
-
258
-
259
-
260
-
261
-
262
-
263
-
264
-
265
-
 266
266 -
 267
267 -
 268
268 -
 269
269 -
 270
270 -
 271
271 -
 272
272 -
 273
273 -
 274
274 -
 275
275 -
 276
276 -
 277
277 -
 278
278 -
 279
279 -
 280
280 -
 281
281 -
 282
282 -
 283
283 -
 284
284 -
 285
285 -
 286
286 -
287
-
288
-
289
-
290
-
291
-
292
-
293
-
294
-
295
-
296
-
297
-
298
-
299
-
300
-
301
-
302
-
303
-
304
-
305
-
306
-
307
-
308
-
309
-
310
-
311
-
312
-
313
-
314
-
315
-
316
-
317
-
318
-
319
-
320
 |
 |

254
Transfers between Level 1 and Level 2 of the Fair
Value Hierarchy
The Company did not have any significant transfers of assets or liabilities
between Levels 1 and 2 of the fair value hierarchy during the twelve months
ended December 31, 2011 and December 31, 2010.
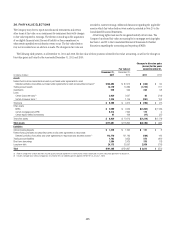
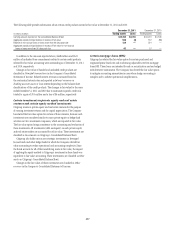
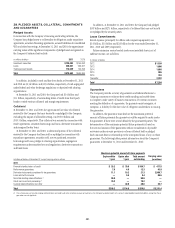
Items Measured at Fair Value on a Nonrecurring Basis
Certain assets and liabilities are measured at fair value on a nonrecurring
basis and therefore are not included in the tables above. These include
assets measured at cost that have been written down to fair value during the
periods as a result of an impairment. In addition, these assets include loans
held-for-sale and other real estate owned that are measured at the lower of
cost or market (LOCOM).
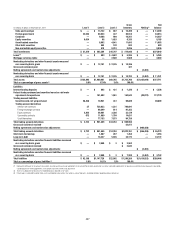
The following table presents the carrying amounts of all assets that were
still held as of December 31, 2011 and December 31, 2010, and for which
a nonrecurring fair value measurement was recorded during the twelve
months then ended:
In millions of dollars Fair value Level 2 Level 3
December 31, 2011
,OANSæHELDFORSALE $ 2,644 $ 1,668 $ 976
/THERæREALæESTATEæOWNED 271 88 183
,OANSæ 3,911 3,185 726
Total assets at fair value on a
nonrecurring basis $ 6,826 $ 4,941 $ 1,885
æ 2EPRESENTSæLOANSæHELDæFORæINVESTMENTæWHOSEæCARRYINGæAMOUNTæISæBASEDæONæTHEæFAIRæVALUEæOFæTHEæ
UNDERLYINGæCOLLATERALæINCLUDINGæPRIMARILYæREALESTATEæSECUREDæLOANS
In millions of dollars Fair value Level 2 Level 3
December 31, 2010 (1)
æ %XCLUDESæLOANSæHELDæFORæINVESTMENTæWHOSEæCARRYINGæAMOUNTæISæBASEDæONæTHEæFAIRæVALUEæOFæ
UNDERLYINGæCOLLATERAL
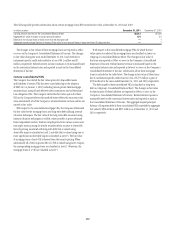
The fair value of loans-held-for-sale is determined where possible using
quoted secondary-market prices. If no such quoted price exists, the fair value
of a loan is determined using quoted prices for a similar asset or assets,
adjusted for the specific attributes of that loan. Fair value for the other real
estate owned is based on appraisals. For loans whose carrying amount is
based on the fair value of the underlying collateral, the fair values depend
on the type of collateral. Fair value of the collateral is typically estimated
based on quoted market prices if available, appraisals or other internal
valuation techniques.
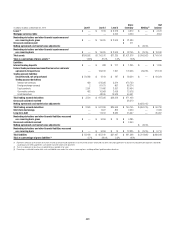
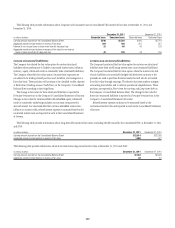
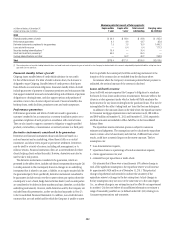
Nonrecurring Fair Value Changes
The following table presents total nonrecurring fair value measurements
for the period, included in earnings, attributable to the change in fair value
relating to assets that are still held at December 31, 2011 and 2010.
In millions of dollars December 31, 2011
,OANSæHELDFORSALE $ (201)
/THERæREALæESTATEæOWNED (71)
,OANSæ (973)
Total nonrecurring fair value gains/losses $(1,245)
æ 2EPRESENTSæLOANSæHELDæFORæINVESTMENTæWHOSEæCARRYINGæAMOUNTæISæBASEDæONæTHEæFAIRæVALUEæOFæTHEæ
UNDERLYINGæCOLLATERALæINCLUDINGæPRIMARILYæREALESTATEæLOANS
In millions of dollars December 31, 2010
Total nonrecurring fair value gains/losses (1)
æ %XCLUDESæLOANSæHELDæFORæINVESTMENTæWHOSEæCARRYINGæAMOUNTæISæBASEDæONæTHEæFAIRæVALUEæOFæ
UNDERLYINGæCOLLATERAL