Citibank 2011 Annual Report Download - page 9
Download and view the complete annual report
Please find page 9 of the 2011 Citibank annual report below. You can navigate through the pages in the report by either clicking on the pages listed below, or by using the keyword search tool below to find specific information within the annual report.-
 1
1 -
 2
2 -
 3
3 -
 4
4 -
 5
5 -
 6
6 -
 7
7 -
 8
8 -
 9
9 -
 10
10 -
 11
11 -
 12
12 -
 13
13 -
 14
14 -
 15
15 -
 16
16 -
 17
17 -
 18
18 -
 19
19 -
 20
20 -
21
-
22
-
23
-
24
-
25
-
26
-
27
-
28
-
29
-
30
-
31
-
32
-
33
-
34
-
35
-
36
-
37
-
38
-
39
-
40
-
41
-
42
-
43
-
44
-
45
-
46
-
47
-
48
-
49
-
50
-
51
-
52
-
53
-
54
-
55
-
56
-
57
-
58
-
59
-
60
-
61
-
62
-
63
-
64
-
65
-
66
-
67
-
68
-
69
-
70
-
71
-
72
-
73
-
74
-
75
-
76
-
77
-
78
-
79
-
80
-
81
-
82
-
83
-
84
-
85
-
86
-
87
-
88
-
89
-
90
-
91
-
92
-
93
-
94
-
95
-
96
-
97
-
98
-
99
-
100
-
101
-
102
-
103
-
104
-
105
-
106
-
107
-
108
-
109
-
110
-
111
-
112
-
113
-
114
-
115
-
116
-
117
-
118
-
119
-
120
-
121
-
122
-
123
-
124
-
125
-
126
-
127
-
128
-
129
-
130
-
131
-
132
-
133
-
134
-
135
-
136
-
137
-
138
-
139
-
140
-
141
-
142
-
143
-
144
-
145
-
146
-
147
-
148
-
149
-
150
-
151
-
152
-
153
-
154
-
155
-
156
-
157
-
158
-
159
-
160
-
161
-
162
-
163
-
164
-
165
-
166
-
167
-
168
-
169
-
170
-
171
-
172
-
173
-
174
-
175
-
176
-
177
-
178
-
179
-
180
-
181
-
182
-
183
-
184
-
185
-
186
-
187
-
188
-
189
-
190
-
191
-
192
-
193
-
194
-
195
-
196
-
197
-
198
-
199
-
200
-
201
-
202
-
203
-
204
-
205
-
206
-
207
-
208
-
209
-
210
-
211
-
212
-
213
-
214
-
215
-
216
-
217
-
218
-
219
-
220
-
221
-
222
-
223
-
224
-
225
-
226
-
227
-
228
-
229
-
230
-
231
-
232
-
233
-
234
-
235
-
236
-
237
-
238
-
239
-
240
-
241
-
242
-
243
-
244
-
245
-
246
-
247
-
248
-
249
-
250
-
251
-
252
-
253
-
254
-
255
-
256
-
257
-
258
-
259
-
260
-
261
-
262
-
263
-
264
-
265
-
266
-
267
-
268
-
269
-
270
-
271
-
272
-
273
-
274
-
275
-
276
-
277
-
278
-
279
-
280
-
281
-
282
-
283
-
284
-
285
-
286
-
287
-
288
-
289
-
290
-
291
-
292
-
293
-
294
-
295
-
296
-
297
-
298
-
299
-
300
-
301
-
302
-
303
-
304
-
305
-
306
-
307
-
308
-
309
-
310
-
311
-
312
-
313
-
314
-
315
-
316
-
317
-
318
-
319
-
320
 |
 |
7
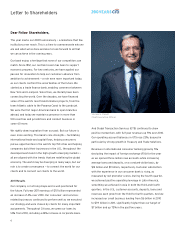
Yet while 2011 was a good year for us, our results fell short of
expectations in the fourth quarter. Fears of a banking crisis
in Europe — or worse, a change in the status of the euro —
affected the entire sector and weighed on client confidence
and activity throughout the world. Market activity was down
significantly, and our clients reduced their risk exposures.
All of our businesses geared to the capital markets — such
as Sales and Trading, Securities and Fund Services in GTS,
and even investment sales in consumer banking — were
adversely impacted.
In addition, we are not completely through with our
remediation efforts. We reduced Citi Holdings assets by an
additional $90 billion in 2011 after many successful sales.
We have split what used to be CitiFinancial into two
components: a servicing portfolio for existing loans and
OneMain Financial, which continues to originate personal
loans in the U.S. This restructuring will help us prepare for
an eventual sale of OneMain, a solid business but one outside
the scope of our core mission and current strategy. As with
every asset in Citi Holdings, we will sell only on economically
rational terms. Now that Retail Partner Cards (renamed Citi
Retail Services) is back in Citicorp, Citi Holdings assets stand
at only 12% of our balance sheet — well below 19% at the end
of last year.
Our expenses rose by $3.6 billion in 2011. Approximately
two-thirds of that was owing to the impact of foreign
exchange and nonoperating expenses such as increased
legal and repositioning charges. Factoring those out, expenses
rose by $1.0 billion, or 2.0%, driven by investments.
Investments in the Future
Despite the soft economy and market turmoil over the
past year, we judged it important to continue making key
investments in the long-term health of our businesses
even as we worked to bolster our quarterly earnings. Thus,
in keeping with our strategy, we invested an additional
$3.9 billion to bring our franchise up to the standards our
clients and regulators expect from a global bank of our
caliber. Nearly half of that, $1.9 billion, was self-funded
through reengineering savings. We also made much-needed
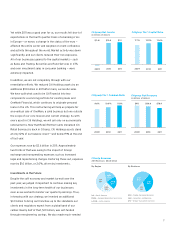
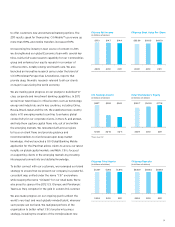
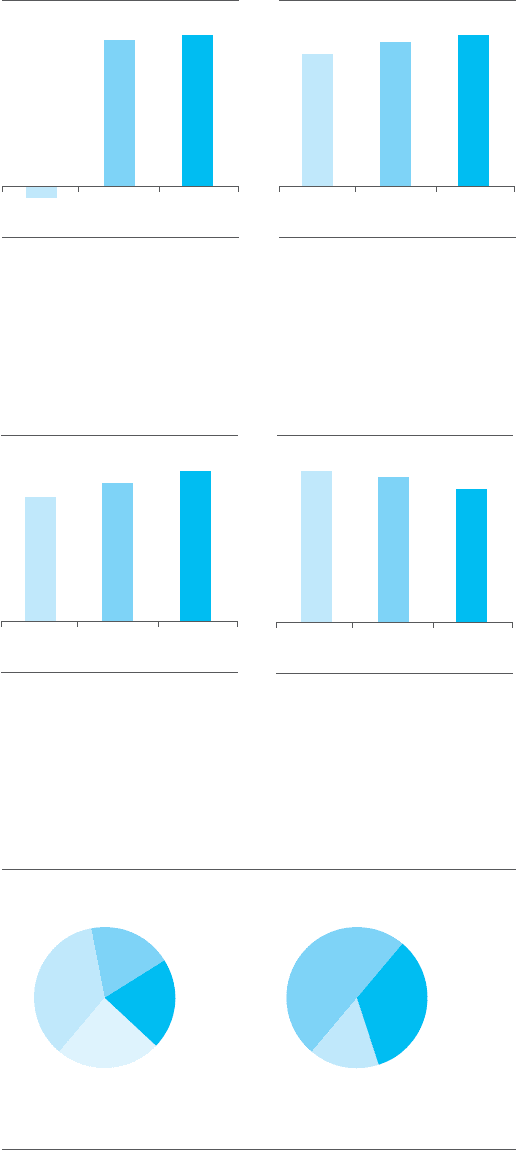
2010 2011
2009
11.7% 12.9% 13.6%
Citigroup Tier 1 Capital Ratio
2010 2011
2009
$(1.6) $10.6 $11.1
Citigroup Net Income
(in billions of dollars)
2010 2011
2009
9.6% 10.8% 11.8%
Citigroup Tier 1 Common Ratio
2010 2011
2009
$91.1 $86.6 $78.4
Citigroup Net Revenues
(in billions of dollars)
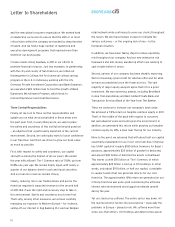
Citicorp Revenues
2011 Revenues: $64.6 billion
By Region By Business
GCB
50%
GTS
16%
S&B
34%
NA
36%
ASIA
24%
LATAM
21%
EMEA
19%
GCB — Global Consumer Banking
S&B — Securities and Banking
GTS — Global Transaction Services
NA — North America
EMEA — Europe, Middle East and Africa
LATAM — Latin America