Citibank 2011 Annual Report Download - page 28
Download and view the complete annual report
Please find page 28 of the 2011 Citibank annual report below. You can navigate through the pages in the report by either clicking on the pages listed below, or by using the keyword search tool below to find specific information within the annual report.-
 1
1 -
2
-
3
-
4
-
5
-
6
-
7
-
8
-
9
-
10
-
11
-
12
-
13
-
14
-
15
-
16
-
17
-
 18
18 -
 19
19 -
 20
20 -
 21
21 -
 22
22 -
 23
23 -
 24
24 -
 25
25 -
 26
26 -
 27
27 -
 28
28 -
 29
29 -
 30
30 -
 31
31 -
 32
32 -
 33
33 -
 34
34 -
 35
35 -
 36
36 -
 37
37 -
 38
38 -
39
-
40
-
41
-
42
-
43
-
44
-
45
-
46
-
47
-
48
-
49
-
50
-
51
-
52
-
53
-
54
-
55
-
56
-
57
-
58
-
59
-
60
-
61
-
62
-
63
-
64
-
65
-
66
-
67
-
68
-
69
-
70
-
71
-
72
-
73
-
74
-
75
-
76
-
77
-
78
-
79
-
80
-
81
-
82
-
83
-
84
-
85
-
86
-
87
-
88
-
89
-
90
-
91
-
92
-
93
-
94
-
95
-
96
-
97
-
98
-
99
-
100
-
101
-
102
-
103
-
104
-
105
-
106
-
107
-
108
-
109
-
110
-
111
-
112
-
113
-
114
-
115
-
116
-
117
-
118
-
119
-
120
-
121
-
122
-
123
-
124
-
125
-
126
-
127
-
128
-
129
-
130
-
131
-
132
-
133
-
134
-
135
-
136
-
137
-
138
-
139
-
140
-
141
-
142
-
143
-
144
-
145
-
146
-
147
-
148
-
149
-
150
-
151
-
152
-
153
-
154
-
155
-
156
-
157
-
158
-
159
-
160
-
161
-
162
-
163
-
164
-
165
-
166
-
167
-
168
-
169
-
170
-
171
-
172
-
173
-
174
-
175
-
176
-
177
-
178
-
179
-
180
-
181
-
182
-
183
-
184
-
185
-
186
-
187
-
188
-
189
-
190
-
191
-
192
-
193
-
194
-
195
-
196
-
197
-
198
-
199
-
200
-
201
-
202
-
203
-
204
-
205
-
206
-
207
-
208
-
209
-
210
-
211
-
212
-
213
-
214
-
215
-
216
-
217
-
218
-
219
-
220
-
221
-
222
-
223
-
224
-
225
-
226
-
227
-
228
-
229
-
230
-
231
-
232
-
233
-
234
-
235
-
236
-
237
-
238
-
239
-
240
-
241
-
242
-
243
-
244
-
245
-
246
-
247
-
248
-
249
-
250
-
251
-
252
-
253
-
254
-
255
-
256
-
257
-
258
-
259
-
260
-
261
-
262
-
263
-
264
-
265
-
266
-
267
-
268
-
269
-
270
-
271
-
272
-
273
-
274
-
275
-
276
-
277
-
278
-
279
-
280
-
281
-
282
-
283
-
284
-
285
-
286
-
287
-
288
-
289
-
290
-
291
-
292
-
293
-
294
-
295
-
296
-
297
-
298
-
299
-
300
-
301
-
302
-
303
-
304
-
305
-
306
-
307
-
308
-
309
-
310
-
311
-
312
-
313
-
314
-
315
-
316
-
317
-
318
-
319
-
320
 |
 |
6
MANAGEMENT’S DISCUSSION AND ANALYSIS OF FINANCIAL CONDITION AND
RESULTS OF OPERATIONS
EXECUTIVE SUMMARY
Market and Economic Environment
During 2011, Citigroup remained focused on executing its strategy of growth
through increasing the returns on and investments in its core businesses of
Citicorp—Global Consumer Banking and Institutional Clients Group—
while continuing to reduce the assets and businesses within Citi Holdings in
an economically rational manner. While Citi continued to make progress
in these areas during the year, its 2011 operating results were impacted by
the ongoing challenging operating environment, particularly in the second
half of the year, as macroeconomic concerns, including in the U.S. and the
Eurozone, weighed heavily on investor and corporate confidence. Market
activity was down globally, with a particular impact on capital markets-
related activities in the fourth quarter of 2011. This affected Citigroup’s
results of operations in many businesses, including not only Securities and
Banking, but also the Securities and Fund Services business in Transaction
Services and investment sales in Global Consumer Banking. Citi believes
that the European sovereign debt crisis and its potential impact on the global
markets and growth will likely continue to create macro uncertainty and
remain an issue until the market, investors and Citi’s clients and customers
believe that a comprehensive resolution to the crisis is structured, and
achievable. Such uncertainty could have a continued negative impact on
investor activity, and thus on Citi’s activity levels and results of operations,
in 2012.
Compounding this continuing macroeconomic uncertainty is the
ongoing uncertainty facing Citigroup and its businesses as a result of
the numerous regulatory initiatives underway, both in the U.S. and
internationally. As of December 31, 2011, regulatory changes in significant
areas, such as Citi’s future capital requirements and prudential standards, the
proposed implementation of the “Volcker Rule” and the proposed regulation
of the derivatives markets, were incomplete and significant rulemaking and
interpretation remained. See “Risk Factors—Regulatory Risks” below. The
continued uncertainty, including the potential costs, associated with the
actual implementation of these changes will continue to require significant
attention by Citi’s management. In addition, it is also not clear what the
cumulative impact of regulatory reform will be.
2011 Summary Results
Citigroup
Citigroup reported net income of $11.1 billion and diluted EPS of $3.63 per
share in 2011, compared to $10.6 billion and $3.54 per share, respectively,
in 2010. In 2011, results included a net positive impact of $1.8 billion from
credit valuation adjustments (CVA) on derivatives (excluding monolines),
net of hedges, and debt valuation adjustments (DVA) on Citigroup’s fair
value option debt, compared to a net negative impact of $(469) million in
2010. In addition, Citi has adjusted its 2011 results of operations that were
previously announced on January 17, 2012 for an additional $209 million
(after tax) charge. This charge relates to the agreement in principle with
the United States and state attorneys general announced on February 9,
2012 regarding the settlement of a number of investigations into residential
loan servicing and origination litigation, as well as the resolution of related
mortgage litigation (see Notes 29, 30 and 32 to the Consolidated Financial
Statements). Excluding CVA/DVA, Citi’s net income declined $952 million, or
9%, to $9.9 billion in 2011, reflecting lower revenues and higher operating
expenses as compared to 2010, partially offset by a significant decline in
credit costs.
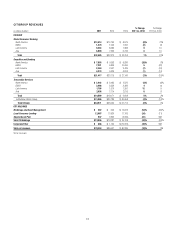
Citi’s revenues of $78.4 billion were down $8.2 billion, or 10%,
compared to 2010. Excluding CVA/DVA, revenues of $76.5 billion were down
$10.5 billion, or 12%, as lower revenues in Citi Holdings and Securities
and Banking more than offset growth in Global Consumer Banking and
Transaction Services. Net interest revenues decreased by $5.7 billion, or 11%,
to $48.4 billion in 2011 as compared to 2010, primarily due to continued
declining loan balances and lower interest-earning assets in Citi Holdings.
Non-interest revenues, excluding CVA/DVA, declined by $4.8 billion, or 15%,
to $28.1 billion in 2011 as compared to 2010, driven by lower revenues in Citi
Holdings and Securities and Banking.
Because of Citi’s extensive global operations, foreign exchange translation
also impacts Citi’s results of operations as Citi translates revenues, expenses,
loan balances and other metrics from foreign currencies to U.S. dollars in
preparing its financial statements. During 2011, the U.S. dollar generally
depreciated versus local currencies in which Citi operates. As a result, the
impact of foreign exchange translation (as used throughout this Form 10-K,
FX translation) accounted for an approximately 1% growth in Citi’s revenues
and 2% growth in expenses, while contributing less than 1% to Citi’s pretax
net income for the year.