Citibank 2011 Annual Report Download - page 58
Download and view the complete annual report
Please find page 58 of the 2011 Citibank annual report below. You can navigate through the pages in the report by either clicking on the pages listed below, or by using the keyword search tool below to find specific information within the annual report.-
 1
1 -
2
-
3
-
4
-
5
-
6
-
7
-
8
-
9
-
10
-
11
-
12
-
13
-
14
-
15
-
16
-
17
-
18
-
19
-
20
-
21
-
22
-
23
-
24
-
25
-
26
-
27
-
28
-
29
-
30
-
31
-
32
-
33
-
34
-
35
-
36
-
37
-
38
-
39
-
40
-
41
-
42
-
43
-
44
-
45
-
46
-
47
-
 48
48 -
 49
49 -
 50
50 -
 51
51 -
 52
52 -
 53
53 -
 54
54 -
 55
55 -
 56
56 -
 57
57 -
 58
58 -
 59
59 -
 60
60 -
 61
61 -
 62
62 -
 63
63 -
 64
64 -
 65
65 -
 66
66 -
 67
67 -
 68
68 -
69
-
70
-
71
-
72
-
73
-
74
-
75
-
76
-
77
-
78
-
79
-
80
-
81
-
82
-
83
-
84
-
85
-
86
-
87
-
88
-
89
-
90
-
91
-
92
-
93
-
94
-
95
-
96
-
97
-
98
-
99
-
100
-
101
-
102
-
103
-
104
-
105
-
106
-
107
-
108
-
109
-
110
-
111
-
112
-
113
-
114
-
115
-
116
-
117
-
118
-
119
-
120
-
121
-
122
-
123
-
124
-
125
-
126
-
127
-
128
-
129
-
130
-
131
-
132
-
133
-
134
-
135
-
136
-
137
-
138
-
139
-
140
-
141
-
142
-
143
-
144
-
145
-
146
-
147
-
148
-
149
-
150
-
151
-
152
-
153
-
154
-
155
-
156
-
157
-
158
-
159
-
160
-
161
-
162
-
163
-
164
-
165
-
166
-
167
-
168
-
169
-
170
-
171
-
172
-
173
-
174
-
175
-
176
-
177
-
178
-
179
-
180
-
181
-
182
-
183
-
184
-
185
-
186
-
187
-
188
-
189
-
190
-
191
-
192
-
193
-
194
-
195
-
196
-
197
-
198
-
199
-
200
-
201
-
202
-
203
-
204
-
205
-
206
-
207
-
208
-
209
-
210
-
211
-
212
-
213
-
214
-
215
-
216
-
217
-
218
-
219
-
220
-
221
-
222
-
223
-
224
-
225
-
226
-
227
-
228
-
229
-
230
-
231
-
232
-
233
-
234
-
235
-
236
-
237
-
238
-
239
-
240
-
241
-
242
-
243
-
244
-
245
-
246
-
247
-
248
-
249
-
250
-
251
-
252
-
253
-
254
-
255
-
256
-
257
-
258
-
259
-
260
-
261
-
262
-
263
-
264
-
265
-
266
-
267
-
268
-
269
-
270
-
271
-
272
-
273
-
274
-
275
-
276
-
277
-
278
-
279
-
280
-
281
-
282
-
283
-
284
-
285
-
286
-
287
-
288
-
289
-
290
-
291
-
292
-
293
-
294
-
295
-
296
-
297
-
298
-
299
-
300
-
301
-
302
-
303
-
304
-
305
-
306
-
307
-
308
-
309
-
310
-
311
-
312
-
313
-
314
-
315
-
316
-
317
-
318
-
319
-
320
 |
 |

36
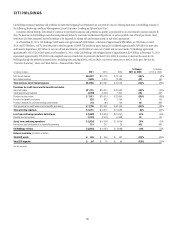
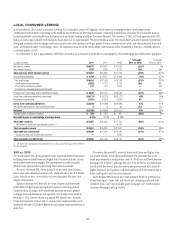
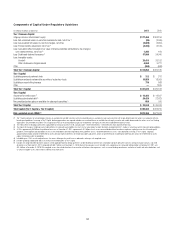
CORPORATE/OTHER
Corporate/Other includes global staff functions (including finance, risk, human resources, legal and compliance) and other corporate expense, global
operations and technology, unallocated Corporate Treasury and Corporate items and discontinued operations. At December 31, 2011, this segment had
approximately $286 billion of assets, or 15% of Citigroup’s total assets, consisting primarily of Citi’s liquidity portfolio.
In millions of dollars 2011
.ETæINTERESTæREVENUE $25 æ
.ONINTERESTæREVENUE 861
Revenues, net of interest expense $ 886
4OTALæOPERATINGæEXPENSES $ 2,522
0ROVISIONSæRELEASESæFORæLOANæLOSSESæANDæFORæBENEFITSæANDæCLAIMS (1)
)NCOMEæLOSSæFROMæCONTINUINGæOPERATIONSæBEFOREæTAXES $(1,635) æ
0ROVISIONæBENEFITSæFORæINCOMEæTAXES (764)
Income (loss) from continuing operations $ (871)
)NCOMEæLOSSæFROMæDISCONTINUEDæOPERATIONSæNETæOFæTAXESæ 112
Net income (loss) before attribution of noncontrolling interests $ (759)
.ETæLOSSæATTRIBUTABLEæTOæNONCONTROLLINGæINTERESTS (27)
Net income (loss) $ (732) æ
2011 vs. 2010
Net loss of $732 million reflected a decline of $886 million compared to
Net income of $154 million in 2010. The decline was primarily due to the
decrease in revenues coupled with the increase in expenses, as well as the
absence of the net gain on the sale of Nikko Cordial Securities and the related
benefit for income taxes recorded in discontinued operations in 2010. This
was partially offset by the absence of the net loss on the sale of The Student
Loan Corporation in 2010 and a net gain on the sale of the Egg Banking plc
credit card business in 2011, each recorded in discontinued operations in the
respective year.
Revenues decreased $868 million, primarily driven by lower investment
yields in Treasury and lower gains on sales of AFS securities, partially offset
by gains on hedging activities and the gain on the sale of a portion of Citi’s
holdings in the Housing Development Finance Corp. (HDFC) in the second
quarter of 2011 (approximately $200 million pretax).
Expenses increased $906 million, due to higher legal and related costs
and continued investment spending, primarily in technology.
2010 vs. 2009
Net loss decreased $8.0 billion, primarily due to the increase in revenues and
the absence of prior-year losses related to Nikko Cordial, partially offset by the
increase in expenses and the net loss on the sale of The Student Loan Corporation.
Revenues increased $12.3 billion, primarily due to the absence of the
loss on debt extinguishment related to the repayment of TARP and the exit
from the loss-sharing agreement with the U.S. government, each in the
fourth quarter of 2009. Revenues also increased due to gains on sales of AFS
securities, benefits from lower short-term interest rates and other improved
Treasury results in 2010. These increases were partially offset by the absence
of the pretax gain related to Citi’s public and private exchange offers in 2009.
Expenses increased $577 million, primarily due to various legal and
related expenses as well as other non-compensation expenses.