Citibank 2011 Annual Report Download - page 39
Download and view the complete annual report
Please find page 39 of the 2011 Citibank annual report below. You can navigate through the pages in the report by either clicking on the pages listed below, or by using the keyword search tool below to find specific information within the annual report.-
 1
1 -
2
-
3
-
4
-
5
-
6
-
7
-
8
-
9
-
10
-
11
-
12
-
13
-
14
-
15
-
16
-
17
-
18
-
19
-
20
-
21
-
22
-
23
-
24
-
25
-
26
-
27
-
28
-
 29
29 -
 30
30 -
 31
31 -
 32
32 -
 33
33 -
 34
34 -
 35
35 -
 36
36 -
 37
37 -
 38
38 -
 39
39 -
 40
40 -
 41
41 -
 42
42 -
 43
43 -
 44
44 -
 45
45 -
 46
46 -
 47
47 -
 48
48 -
 49
49 -
50
-
51
-
52
-
53
-
54
-
55
-
56
-
57
-
58
-
59
-
60
-
61
-
62
-
63
-
64
-
65
-
66
-
67
-
68
-
69
-
70
-
71
-
72
-
73
-
74
-
75
-
76
-
77
-
78
-
79
-
80
-
81
-
82
-
83
-
84
-
85
-
86
-
87
-
88
-
89
-
90
-
91
-
92
-
93
-
94
-
95
-
96
-
97
-
98
-
99
-
100
-
101
-
102
-
103
-
104
-
105
-
106
-
107
-
108
-
109
-
110
-
111
-
112
-
113
-
114
-
115
-
116
-
117
-
118
-
119
-
120
-
121
-
122
-
123
-
124
-
125
-
126
-
127
-
128
-
129
-
130
-
131
-
132
-
133
-
134
-
135
-
136
-
137
-
138
-
139
-
140
-
141
-
142
-
143
-
144
-
145
-
146
-
147
-
148
-
149
-
150
-
151
-
152
-
153
-
154
-
155
-
156
-
157
-
158
-
159
-
160
-
161
-
162
-
163
-
164
-
165
-
166
-
167
-
168
-
169
-
170
-
171
-
172
-
173
-
174
-
175
-
176
-
177
-
178
-
179
-
180
-
181
-
182
-
183
-
184
-
185
-
186
-
187
-
188
-
189
-
190
-
191
-
192
-
193
-
194
-
195
-
196
-
197
-
198
-
199
-
200
-
201
-
202
-
203
-
204
-
205
-
206
-
207
-
208
-
209
-
210
-
211
-
212
-
213
-
214
-
215
-
216
-
217
-
218
-
219
-
220
-
221
-
222
-
223
-
224
-
225
-
226
-
227
-
228
-
229
-
230
-
231
-
232
-
233
-
234
-
235
-
236
-
237
-
238
-
239
-
240
-
241
-
242
-
243
-
244
-
245
-
246
-
247
-
248
-
249
-
250
-
251
-
252
-
253
-
254
-
255
-
256
-
257
-
258
-
259
-
260
-
261
-
262
-
263
-
264
-
265
-
266
-
267
-
268
-
269
-
270
-
271
-
272
-
273
-
274
-
275
-
276
-
277
-
278
-
279
-
280
-
281
-
282
-
283
-
284
-
285
-
286
-
287
-
288
-
289
-
290
-
291
-
292
-
293
-
294
-
295
-
296
-
297
-
298
-
299
-
300
-
301
-
302
-
303
-
304
-
305
-
306
-
307
-
308
-
309
-
310
-
311
-
312
-
313
-
314
-
315
-
316
-
317
-
318
-
319
-
320
 |
 |
17
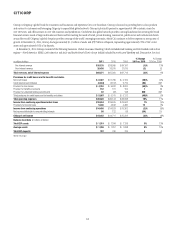
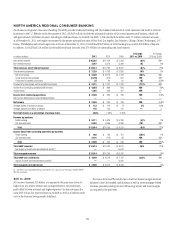
Net interest revenue decreased 8%, driven primarily by lower cards net
interest margin which was negatively impacted by the look-back provision of
The Credit Card Accountability Responsibility and Disclosure Act (CARD Act).
As previously disclosed, the look-back provision of the CARD Act generally
requires a review to be done once every six months for card accounts where
the annual percentage rate (APR) has been increased since January 1, 2009
to assess whether changes in credit risk, market conditions or other factors
merit a future decline in the APR. In addition, net interest margin for cards
was negatively impacted by higher promotional balances and lower total
average loans. As a result, cards net interest revenue as a percentage of
average loans decreased to 9.48% from 10.28% in the prior year. Citi expects
margin growth to remain under pressure into 2012 given the continued
investment spending in the business during 2012, which largely began in the
second half of 2011.
Non-interest revenue decreased 9%, primarily due to lower gains
from the sale of mortgage loans as Citi held more loans on-balance sheet.
In addition, the decline in non-interest revenue reflected lower banking
fee income.
Expenses increased 19%, primarily driven by the higher investment
spending in the business during the second half of 2011, particularly
in cards marketing and technology, and increases in litigation accruals
related to the interchange litigation (see Note 29 to the Consolidated
Financial Statements).
Provisions decreased $5.5 billion, or 71%, primarily due to a loan loss
reserve release of $2.7 billion in 2011, compared to a loan loss reserve release
of $0.3 billion in 2010, and lower net credit losses in the Citi-branded cards
portfolio. Cards net credit losses were down $3.0 billion, or 39%, from 2010,
and the net credit loss ratio decreased 366 basis points to 6.36% for 2011. The
decline in credit costs was driven by improving credit conditions as well as
continued stricter underwriting criteria, which lowered the cards risk profile.
As referenced above, Citi believes the improvements in, and Citi’s resulting
benefit from, declining credit costs in NA RCB will likely slow into 2012.
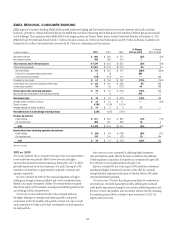
2010 vs. 2009
Net income declined by $139 million, or 18%, as compared to the prior year,
driven by higher credit costs due to Citi’s adoption of SFAS 166/167, partially
offset by higher revenues.
Revenues increased 72% from the prior year, primarily due to the
consolidation of securitized credit card receivables pursuant to the adoption
of SFAS 166/167 effective January 1, 2010. On a comparable basis, revenues
declined 3% from the prior year, mainly due to lower volumes in Citi-branded
cards as well as the net impact of the CARD Act on cards revenues. This
decrease was partially offset by better mortgage-related revenues driven by
higher refinancing activity.
Net interest revenue was down 6% on a comparable basis driven
primarily by lower volumes in cards, with average managed loans down
7% from the prior year, and in retail banking, where average loans declined
11%. The decline in cards was driven by the stricter underwriting criteria
referenced above as well as the impact of CARD Act. The increase in deposit
volumes, up 3% from the prior year, was offset by lower spreads due to the
then-current interest rate environment.
Non-interest revenue increased 6% on a comparable basis from the prior
year mainly driven by better servicing hedge results and higher gains on sale
from the sale of mortgage loans.
Expenses increased 5% from the prior year, driven by the impact of
higher litigation accruals, primarily in the first quarter of 2010, and higher
marketing costs.
Provisions increased $6.0 billion, primarily due to the consolidation of
securitized credit card receivables pursuant to the adoption of SFAS 166/167.
On a comparable basis, provisions decreased $0.9 billion, or 11%, primarily
due to a net loan loss reserve release of $0.3 billion in 2010 compared to a
$0.5 billion loan loss reserve build in the prior year coupled with lower net
credit losses in the cards portfolio. Also on a comparable basis, the cards
net credit loss ratio increased 61 basis points to 10.02%, driven by lower
average loans.