Citibank 2011 Annual Report Download - page 131
Download and view the complete annual report
Please find page 131 of the 2011 Citibank annual report below. You can navigate through the pages in the report by either clicking on the pages listed below, or by using the keyword search tool below to find specific information within the annual report.-
 1
1 -
2
-
3
-
4
-
5
-
6
-
7
-
8
-
9
-
10
-
11
-
12
-
13
-
14
-
15
-
16
-
17
-
18
-
19
-
20
-
21
-
22
-
23
-
24
-
25
-
26
-
27
-
28
-
29
-
30
-
31
-
32
-
33
-
34
-
35
-
36
-
37
-
38
-
39
-
40
-
41
-
42
-
43
-
44
-
45
-
46
-
47
-
48
-
49
-
50
-
51
-
52
-
53
-
54
-
55
-
56
-
57
-
58
-
59
-
60
-
61
-
62
-
63
-
64
-
65
-
66
-
67
-
68
-
69
-
70
-
71
-
72
-
73
-
74
-
75
-
76
-
77
-
78
-
79
-
80
-
81
-
82
-
83
-
84
-
85
-
86
-
87
-
88
-
89
-
90
-
91
-
92
-
93
-
94
-
95
-
96
-
97
-
98
-
99
-
100
-
101
-
102
-
103
-
104
-
105
-
106
-
107
-
108
-
109
-
110
-
111
-
112
-
113
-
114
-
115
-
116
-
117
-
118
-
119
-
120
-
 121
121 -
 122
122 -
 123
123 -
 124
124 -
 125
125 -
 126
126 -
 127
127 -
 128
128 -
 129
129 -
 130
130 -
 131
131 -
 132
132 -
 133
133 -
 134
134 -
 135
135 -
 136
136 -
 137
137 -
 138
138 -
 139
139 -
 140
140 -
 141
141 -
142
-
143
-
144
-
145
-
146
-
147
-
148
-
149
-
150
-
151
-
152
-
153
-
154
-
155
-
156
-
157
-
158
-
159
-
160
-
161
-
162
-
163
-
164
-
165
-
166
-
167
-
168
-
169
-
170
-
171
-
172
-
173
-
174
-
175
-
176
-
177
-
178
-
179
-
180
-
181
-
182
-
183
-
184
-
185
-
186
-
187
-
188
-
189
-
190
-
191
-
192
-
193
-
194
-
195
-
196
-
197
-
198
-
199
-
200
-
201
-
202
-
203
-
204
-
205
-
206
-
207
-
208
-
209
-
210
-
211
-
212
-
213
-
214
-
215
-
216
-
217
-
218
-
219
-
220
-
221
-
222
-
223
-
224
-
225
-
226
-
227
-
228
-
229
-
230
-
231
-
232
-
233
-
234
-
235
-
236
-
237
-
238
-
239
-
240
-
241
-
242
-
243
-
244
-
245
-
246
-
247
-
248
-
249
-
250
-
251
-
252
-
253
-
254
-
255
-
256
-
257
-
258
-
259
-
260
-
261
-
262
-
263
-
264
-
265
-
266
-
267
-
268
-
269
-
270
-
271
-
272
-
273
-
274
-
275
-
276
-
277
-
278
-
279
-
280
-
281
-
282
-
283
-
284
-
285
-
286
-
287
-
288
-
289
-
290
-
291
-
292
-
293
-
294
-
295
-
296
-
297
-
298
-
299
-
300
-
301
-
302
-
303
-
304
-
305
-
306
-
307
-
308
-
309
-
310
-
311
-
312
-
313
-
314
-
315
-
316
-
317
-
318
-
319
-
320
 |
 |
109
Net current funded credit exposure also reflects a reduction for $5.1 billion
in purchased credit protection, predominantly from financial institutions
outside GIIPS and France. Such protection generally pays out only upon the
occurrence of certain credit events with respect to the country or borrower
covered by the protection, as determined by a committee composed of
dealers and other market participants. In addition to counterparty credit
risks (see “Credit Default Swaps” below), the credit protection may not fully
cover all situations that may adversely affect the value of Citi’s exposure
and, accordingly, Citi could still experience losses despite the existence of the
credit protection.
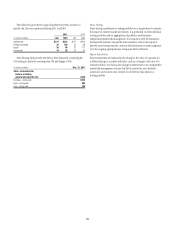
Unfunded Commitments—$16.1 billion
As of December 31, 2011, Citi also had $16.1 billion of unfunded
commitments to the French sovereign, financial institutions and
corporations, with $11.9 billion of this amount to corporations. These
unfunded lines generally have standard conditions that must be met before
they can be drawn.
Other Activities
Similar to other banks, Citi also provides settlement and clearing facilities for
a variety of clients in France and actively monitors and manages these intra-
day exposures. Citi also has locally funded exposure in France; however, as of
December 31, 2011, the amount of this exposure was not material.
Credit Default Swaps
Citi buys and sells credit protection, through credit default swaps, on
underlying GIIPS or French entities as part of its market-making activities for
clients in its trading portfolios. Citi also purchases credit protection, through
credit default swaps, to hedge its own credit exposure to these underlying
entities that arises from loans to these entities or derivative transactions with
these entities.
Citi buys and sells credit default swaps as part of its market-making
activity, and purchases credit default swaps for credit protection, with
financial institutions that Citi believes are of high quality. The counterparty
credit exposure that can arise from the purchase or sale of credit default
swaps is usually covered by legally enforceable netting and margining
agreements with a given counterparty, so that the credit exposure to that
counterparty is measured and managed in aggregate across all products
covered by a given netting or margining agreement.
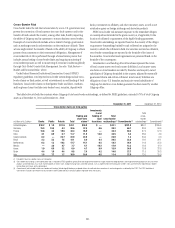
The notional amount of credit protection purchased or sold on GIIPS or
French underlying single reference entities as of December 31, 2011 is set
forth in the table below. The net notional contract amounts, less mark-to-
market adjustments, are included in “net current funded exposure” in the
table under “GIIPS and France” above, and appear in either “net trading
exposure” when part of a trading strategy or in “purchased credit protection”
when purchased as a hedge against a credit exposure (see note 1 to the
table below).
Credit default swaps purchased or sold on underlying single reference entities in these countries (1)
In billions of U.S. dollars GIIPS Greece Ireland Italy Portugal Spain France
Notional CDS contracts on underlying reference entities (1)
Net purchased (2) $ (16.9) $(1.0) $(1.0) $(9.2) $ (1.9) $(7.6) $ (10.4)
Net sold (2) 7.8 1.0 0.7 2.7 2.0 5.3 6.4
3OVEREIGNæUNDERLYINGæREFERENCEæENTITY
.ETæPURCHASEDæ (11.7) (0.8) (0.6) (7.4) (1.2) (4.5) (4.6)
.ETæSOLDæ 5.7 0.8 0.6 1.9 1.2 4.0 4.5
&INANCIALæINSTITUTIONæUNDERLYINGæREFERENCEæENTITY
.ETæPURCHASEDæ (2.9) — (0.4) (1.3) (0.4) (1.3) (1.8)
.ETæSOLDæ 2.4 — 0.1 1.4 0.4 1.0 1.6
#ORPORATEæUNDERLYINGæREFERENCEæENTITY
.ETæPURCHASEDæ (5.2) (0.4) (0.2) (2.4) (0.7) (2.8) (6.7)
.ETæSOLDæ 2.6 0.3 0.2 1.4 0.8 1.2 3.0
æ 4HEæNETæNOTIONALæCONTRACTæAMOUNTSæLESSæMARKTOMARKETæADJUSTMENTSæAREæINCLUDEDæINæ#ITISæhNETæCURRENTæFUNDEDæEXPOSUREvæINæTHEæTABLEæUNDERæh'))03æANDæ&RANCEvæONæPAGEææ4HESEæAMOUNTSæAREæREFLECTEDæINæTWOæPLACESæ
INæSUCHæTABLEææBILLIONæANDææBILLIONæFORæ'))03æANDæ&RANCEæRESPECTIVELYæAREæINCLUDEDæINæhPURCHASEDæCREDITæPROTECTIONvæHEDGINGæhGROSSæFUNDEDæCREDITæEXPOSUREvæ4HEæREMAININGæACTIVITYæISæREFLECTEDæINæhNETæTRADINGæ
EXPOSUREvæSINCEæTHESEæPOSITIONSæAREæPARTæOFæAæTRADINGæSTRATEGY
æ 4HEæSUMMATIONæOFæNOTIONALæAMOUNTSæFORæEACHæ'))03æCOUNTRYæDOESæNOTæEQUALæTHEæNOTIONALæAMOUNTæPRESENTEDæINæTHEæ'))03æTOTALæCOLUMNæINæTHEæTABLEæABOVEæASæADDITIONALæNETTINGæISæACHIEVEDæATæTHEæAGREEMENTæLEVELæWITHæAæ
SPECIFICæCOUNTERPARTYæACROSSæVARIOUSæ'))03æCOUNTRIES