Citibank 2011 Annual Report Download - page 129
Download and view the complete annual report
Please find page 129 of the 2011 Citibank annual report below. You can navigate through the pages in the report by either clicking on the pages listed below, or by using the keyword search tool below to find specific information within the annual report.-
 1
1 -
2
-
3
-
4
-
5
-
6
-
7
-
8
-
9
-
10
-
11
-
12
-
13
-
14
-
15
-
16
-
17
-
18
-
19
-
20
-
21
-
22
-
23
-
24
-
25
-
26
-
27
-
28
-
29
-
30
-
31
-
32
-
33
-
34
-
35
-
36
-
37
-
38
-
39
-
40
-
41
-
42
-
43
-
44
-
45
-
46
-
47
-
48
-
49
-
50
-
51
-
52
-
53
-
54
-
55
-
56
-
57
-
58
-
59
-
60
-
61
-
62
-
63
-
64
-
65
-
66
-
67
-
68
-
69
-
70
-
71
-
72
-
73
-
74
-
75
-
76
-
77
-
78
-
79
-
80
-
81
-
82
-
83
-
84
-
85
-
86
-
87
-
88
-
89
-
90
-
91
-
92
-
93
-
94
-
95
-
96
-
97
-
98
-
99
-
100
-
101
-
102
-
103
-
104
-
105
-
106
-
107
-
108
-
109
-
110
-
111
-
112
-
113
-
114
-
115
-
116
-
117
-
118
-
 119
119 -
 120
120 -
 121
121 -
 122
122 -
 123
123 -
 124
124 -
 125
125 -
 126
126 -
 127
127 -
 128
128 -
 129
129 -
 130
130 -
 131
131 -
 132
132 -
 133
133 -
 134
134 -
 135
135 -
 136
136 -
 137
137 -
 138
138 -
 139
139 -
140
-
141
-
142
-
143
-
144
-
145
-
146
-
147
-
148
-
149
-
150
-
151
-
152
-
153
-
154
-
155
-
156
-
157
-
158
-
159
-
160
-
161
-
162
-
163
-
164
-
165
-
166
-
167
-
168
-
169
-
170
-
171
-
172
-
173
-
174
-
175
-
176
-
177
-
178
-
179
-
180
-
181
-
182
-
183
-
184
-
185
-
186
-
187
-
188
-
189
-
190
-
191
-
192
-
193
-
194
-
195
-
196
-
197
-
198
-
199
-
200
-
201
-
202
-
203
-
204
-
205
-
206
-
207
-
208
-
209
-
210
-
211
-
212
-
213
-
214
-
215
-
216
-
217
-
218
-
219
-
220
-
221
-
222
-
223
-
224
-
225
-
226
-
227
-
228
-
229
-
230
-
231
-
232
-
233
-
234
-
235
-
236
-
237
-
238
-
239
-
240
-
241
-
242
-
243
-
244
-
245
-
246
-
247
-
248
-
249
-
250
-
251
-
252
-
253
-
254
-
255
-
256
-
257
-
258
-
259
-
260
-
261
-
262
-
263
-
264
-
265
-
266
-
267
-
268
-
269
-
270
-
271
-
272
-
273
-
274
-
275
-
276
-
277
-
278
-
279
-
280
-
281
-
282
-
283
-
284
-
285
-
286
-
287
-
288
-
289
-
290
-
291
-
292
-
293
-
294
-
295
-
296
-
297
-
298
-
299
-
300
-
301
-
302
-
303
-
304
-
305
-
306
-
307
-
308
-
309
-
310
-
311
-
312
-
313
-
314
-
315
-
316
-
317
-
318
-
319
-
320
 |
 |

107
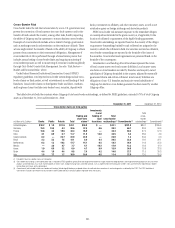
COUNTRY AND CROSS-BORDER RISK
Country Risk
Country risk is the risk that an event in a country (precipitated by
developments within or external to a country) will impair the value of Citi’s
franchise or will adversely affect the ability of obligors within that country
to honor their obligations to Citi. Country risk events may include sovereign
defaults, banking defaults or crises, currency crises and/or political events.
See also “Risk Factors—Market and Economic Risks” above.
The information below is based on Citi’s internal risk management
measures. The country designation in Citi’s risk management systems is
based on the country to which the client relationship, taken as a whole, is
most directly exposed to economic, financial, sociopolitical or legal risks.
This includes exposure to subsidiaries within the client relationship that are
domiciled outside of the country.
Citi assesses the risk of loss associated with certain of the country
exposures on a regular basis. These analyses take into consideration
alternative scenarios that may unfold, as well as specific characteristics of
Citi’s portfolio, such as transaction structure and collateral. Citi currently
believes that the risk of loss associated with the exposures set forth below is
likely materially lower than the exposure amounts disclosed below and is
sized appropriately relative to its franchise in these countries. For additional
information relating to Citi’s risk management practices, see “Managing
Global Risk” above.
The sovereign entities of all the countries disclosed below, as well as the
financial institutions and corporations domiciled in these countries, are
important clients in the global Citi franchise. Citi fully expects to maintain its
presence in these markets to service all of its global customers. As such, Citi’s
exposure in these countries may vary over time, based upon its franchise,
client needs and transaction structures.
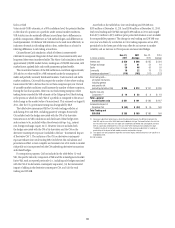
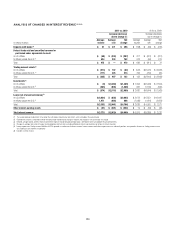
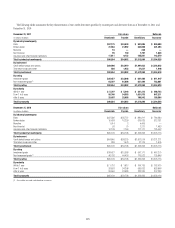
GIIPS and France
Several European countries, including Greece, Ireland, Italy, Portugal, Spain and France, have been the subject of credit deterioration due to weaknesses in their
economic and fiscal situations. Given investor interest in this area, the table below sets forth Citi’s exposures to these countries as of December 31, 2011.
In billions of U.S. dollars GIIPS (1) Greece Ireland Italy Portugal Spain France
&UNDEDæLOANSæBEFOREæRESERVES $ 9.4 $ 1.1 $ 0.3 $ 1.9 $ 0.4 $ 5.7 $ 4.7
$ERIVATIVEæCOUNTERPARTYæMARKTOMARKETæINCLUSIVEæOFæ#6!æ 10.8 0.6 0.6 7.3 0.3 2.0 7.0
'ROSSæFUNDEDæCREDITæEXPOSURE $20.2 $ 1.7 $ 0.9 $ 9.2 $ 0.7 $ 7.7 $11.7
,ESSæMARGINæANDæCOLLATERALæ (4.2) (0.2) (0.4) (1.2) (0.1) (2.3) (5.3)
,ESSæPURCHASEDæCREDITæPROTECTIONæ (9.6) (0.1) (0.1) (6.7) (0.2) (2.5) (5.1)
Net current funded credit exposure $ 6.4 $ 1.4 $ 0.4 $ 1.3 $ 0.4 $ 2.9 $ 1.3
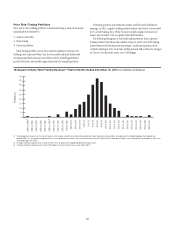
.ETæTRADINGæEXPOSURE $ 1.1 $ 0.1 $ 0.2 $ 0.2 $ — $ 0.6 $ 0.3
!&3æEXPOSURE 0.2 — — 0.2 — — 0.3
Net trading and AFS exposure $ 1.3 $ 0.1 $ 0.2 $ 0.4 $ — $ 0.6 $ 0.6
Net current funded exposure $ 7.7 $ 1.5 $ 0.6 $ 1.7 $ 0.4 $ 3.5 $ 1.9
Additional collateral received, not reducing amounts above $ (4.3) $ (1.2) $(0.2) $(0.4) $ — $(2.5) $ (4.6)
Net current funded credit exposure detail:
3OVEREIGNS $ 0.7 $ 0.1 $ — $ 0.4 $ 0.2 $ — $ —
&INANCIALæINSTITUTIONS 1.6 — — 0.1 — 1.5 1.9
#ORPORATIONS 4.1 1.3 0.4 0.8 0.2 1.4 (0.6)
Net current funded credit exposure $ 6.4 $ 1.4 $ 0.4 $ 1.3 $ 0.4 $ 2.9 $ 1.3
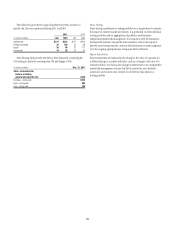
Unfunded commitments:
3OVEREIGNS $ 0.3 $ — $ — $ — $ — $ 0.3 $ 0.8
&INANCIALæINSTITUTIONS 0.3 — — 0.1 — 0.2 3.4
#ORPORATIONS 6.7 0.4 $ 0.5 3.1 0.3 2.4 11.9
Total unfunded commitments $ 7.3 $ 0.4 $ 0.5 $ 3.2 $ 0.3 $ 2.9 $16.1
.OTEæ)NFORMATIONæBASEDæONæ#ITISæINTERNALæRISKæMANAGEMENTæMEASURES
æ 'REECEæ)RELANDæ)TALYæ0ORTUGALæANDæ3PAIN
æ )NCLUDESæTHEæNETæCREDITæEXPOSUREæARISINGæFROMæSECUREDæFINANCINGæTRANSACTIONSæSUCHæASæREPURCHASEæAGREEMENTSæANDæREVERSEæREPURCHASEæAGREEMENTSæ3EEæh3ECUREDæ&INANCINGæ4RANSACTIONSvæBELOW
æ -ARGINæPOSTEDæUNDERæLEGALLYæENFORCEABLEæMARGINæAGREEMENTSæANDæCOLLATERALæPLEDGEDæUNDERæBANKRUPTCYREMOTEæSTRUCTURESæ$OESæNOTæINCLUDEæCOLLATERALæRECEIVEDæONæSECUREDæFINANCINGæTRANSACTIONS
æ #REDITæPROTECTIONæPURCHASEDæFROMæFINANCIALæINSTITUTIONSæPREDOMINATELYæOUTSIDEæOFæ'))03æANDæ&RANCEæ3EEæh#REDITæ$EFAULTæ3WAPSvæBELOW