Citibank 2011 Annual Report Download - page 190
Download and view the complete annual report
Please find page 190 of the 2011 Citibank annual report below. You can navigate through the pages in the report by either clicking on the pages listed below, or by using the keyword search tool below to find specific information within the annual report.-
 1
1 -
2
-
3
-
4
-
5
-
6
-
7
-
8
-
9
-
10
-
11
-
12
-
13
-
14
-
15
-
16
-
17
-
18
-
19
-
20
-
21
-
22
-
23
-
24
-
25
-
26
-
27
-
28
-
29
-
30
-
31
-
32
-
33
-
34
-
35
-
36
-
37
-
38
-
39
-
40
-
41
-
42
-
43
-
44
-
45
-
46
-
47
-
48
-
49
-
50
-
51
-
52
-
53
-
54
-
55
-
56
-
57
-
58
-
59
-
60
-
61
-
62
-
63
-
64
-
65
-
66
-
67
-
68
-
69
-
70
-
71
-
72
-
73
-
74
-
75
-
76
-
77
-
78
-
79
-
80
-
81
-
82
-
83
-
84
-
85
-
86
-
87
-
88
-
89
-
90
-
91
-
92
-
93
-
94
-
95
-
96
-
97
-
98
-
99
-
100
-
101
-
102
-
103
-
104
-
105
-
106
-
107
-
108
-
109
-
110
-
111
-
112
-
113
-
114
-
115
-
116
-
117
-
118
-
119
-
120
-
121
-
122
-
123
-
124
-
125
-
126
-
127
-
128
-
129
-
130
-
131
-
132
-
133
-
134
-
135
-
136
-
137
-
138
-
139
-
140
-
141
-
142
-
143
-
144
-
145
-
146
-
147
-
148
-
149
-
150
-
151
-
152
-
153
-
154
-
155
-
156
-
157
-
158
-
159
-
160
-
161
-
162
-
163
-
164
-
165
-
166
-
167
-
168
-
169
-
170
-
171
-
172
-
173
-
174
-
175
-
176
-
177
-
178
-
179
-
 180
180 -
 181
181 -
 182
182 -
 183
183 -
 184
184 -
 185
185 -
 186
186 -
 187
187 -
 188
188 -
 189
189 -
 190
190 -
 191
191 -
 192
192 -
 193
193 -
 194
194 -
 195
195 -
 196
196 -
 197
197 -
 198
198 -
 199
199 -
 200
200 -
201
-
202
-
203
-
204
-
205
-
206
-
207
-
208
-
209
-
210
-
211
-
212
-
213
-
214
-
215
-
216
-
217
-
218
-
219
-
220
-
221
-
222
-
223
-
224
-
225
-
226
-
227
-
228
-
229
-
230
-
231
-
232
-
233
-
234
-
235
-
236
-
237
-
238
-
239
-
240
-
241
-
242
-
243
-
244
-
245
-
246
-
247
-
248
-
249
-
250
-
251
-
252
-
253
-
254
-
255
-
256
-
257
-
258
-
259
-
260
-
261
-
262
-
263
-
264
-
265
-
266
-
267
-
268
-
269
-
270
-
271
-
272
-
273
-
274
-
275
-
276
-
277
-
278
-
279
-
280
-
281
-
282
-
283
-
284
-
285
-
286
-
287
-
288
-
289
-
290
-
291
-
292
-
293
-
294
-
295
-
296
-
297
-
298
-
299
-
300
-
301
-
302
-
303
-
304
-
305
-
306
-
307
-
308
-
309
-
310
-
311
-
312
-
313
-
314
-
315
-
316
-
317
-
318
-
319
-
320
 |
 |

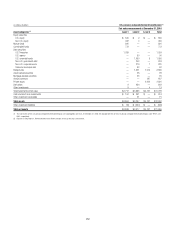
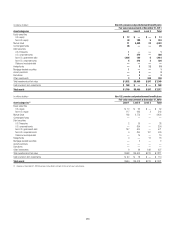
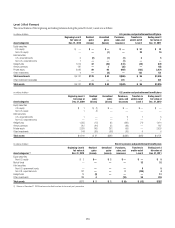
168
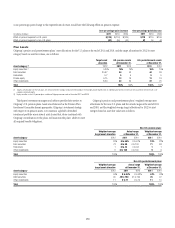
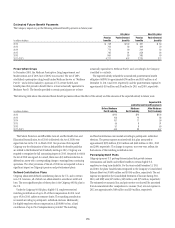
Plan Assumptions
Citigroup utilizes a number of assumptions to determine plan obligations
and expense. Changes in one or a combination of these assumptions
will have an impact on the Company’s pension and postretirement PBO,
funded status and benefit expense. Changes in the plans’ funded status
resulting from changes in the PBO and fair value of plan assets will have a
corresponding impact on Accumulated other comprehensive income (loss).
A discussion of certain assumptions follows.
Discount Rate
The discount rates for the U.S. pension and postretirement plans were selected
by reference to a Citigroup-specific analysis using each plan’s specific
cash flows and compared with high quality corporate bond indices for
reasonableness. Citigroup’s policy is to round to the nearest five hundredths
of a percent. Accordingly, at December 31, 2011, the discount rate was set
at 4.70% for the pension plans and 4.30% for the postretirement plans. At
December 31, 2010, the discount rate was set at 5.45% for the pension plans
and 5.10% for the postretirement plans, referencing a Citigroup-specific cash
flow analysis.
The discount rates for the non-U.S. pension and postretirement plans are
selected by reference to high quality corporate bond rates in countries that
have developed corporate bond markets. However, where developed corporate
bond markets do not exist, the discount rates are selected by reference to local
government bond rates with a premium added to reflect the additional risk
for corporate bonds.
The discount rate and future rate of compensation assumptions used in
determining pension and postretirement benefit obligations and net benefit
expense for the Company’s plans are shown in the following table:
At year end 2011
Discount rate
53æPLANSæ
0ENSION 4.70%
0OSTRETIREMENT 4.30 æ
.ON53æPENSIONæPLANS
2ANGE 1.75 to 13.25 æTOæ
7EIGHTEDæAVERAGEæ 5.94
Future compensation increase rate
53æPLANSæ 3.00
.ON53æPENSIONæPLANS
2ANGE 1.60 to 13.30 æTOæ
7EIGHTEDæAVERAGE 4.04
During the year 2011
Discount rate
53æPLANSæ
0ENSION 5.45%
0OSTRETIREMENT 5.10
.ON53æPENSIONæPLANS
2ANGE 1.75 to 14.00 æTOæ
7EIGHTEDæAVERAGE 6.23 æ
Future compensation increase rate
53æPLANSæ 3.00
.ON53æPENSIONæPLANS
2ANGE 1.00 to 11.00 æTOæ
7EIGHTEDæAVERAGE 4.66
æ 7EIGHTEDAVERAGEæRATESæFORæTHEæ53æPLANSæEQUALæTHEæSTATEDæRATES
æ %FFECTIVEæ*ANUARYæææTHEæ53æQUALIFIEDæPENSIONæPLANæWASæFROZENæEXCEPTæFORæCERTAINæGRANDFATHEREDæ
EMPLOYEESæACCRUINGæBENEFITSæUNDERæAæFINALæPAYæPLANæFORMULAæ/NLYæTHEæFUTUREæCOMPENSATIONæINCREASESæ
FORæTHESEæGRANDFATHEREDæEMPLOYEESæWILLæAFFECTæFUTUREæPENSIONæEXPENSEæANDæOBLIGATIONSæ&UTUREæ
COMPENSATIONæINCREASEæRATESæFORæSMALLæGROUPSæOFæEMPLOYEESæWEREæ