Citibank 2011 Annual Report Download - page 61
Download and view the complete annual report
Please find page 61 of the 2011 Citibank annual report below. You can navigate through the pages in the report by either clicking on the pages listed below, or by using the keyword search tool below to find specific information within the annual report.-
 1
1 -
2
-
3
-
4
-
5
-
6
-
7
-
8
-
9
-
10
-
11
-
12
-
13
-
14
-
15
-
16
-
17
-
18
-
19
-
20
-
21
-
22
-
23
-
24
-
25
-
26
-
27
-
28
-
29
-
30
-
31
-
32
-
33
-
34
-
35
-
36
-
37
-
38
-
39
-
40
-
41
-
42
-
43
-
44
-
45
-
46
-
47
-
48
-
49
-
50
-
 51
51 -
 52
52 -
 53
53 -
 54
54 -
 55
55 -
 56
56 -
 57
57 -
 58
58 -
 59
59 -
 60
60 -
 61
61 -
 62
62 -
 63
63 -
 64
64 -
 65
65 -
 66
66 -
 67
67 -
 68
68 -
 69
69 -
 70
70 -
 71
71 -
72
-
73
-
74
-
75
-
76
-
77
-
78
-
79
-
80
-
81
-
82
-
83
-
84
-
85
-
86
-
87
-
88
-
89
-
90
-
91
-
92
-
93
-
94
-
95
-
96
-
97
-
98
-
99
-
100
-
101
-
102
-
103
-
104
-
105
-
106
-
107
-
108
-
109
-
110
-
111
-
112
-
113
-
114
-
115
-
116
-
117
-
118
-
119
-
120
-
121
-
122
-
123
-
124
-
125
-
126
-
127
-
128
-
129
-
130
-
131
-
132
-
133
-
134
-
135
-
136
-
137
-
138
-
139
-
140
-
141
-
142
-
143
-
144
-
145
-
146
-
147
-
148
-
149
-
150
-
151
-
152
-
153
-
154
-
155
-
156
-
157
-
158
-
159
-
160
-
161
-
162
-
163
-
164
-
165
-
166
-
167
-
168
-
169
-
170
-
171
-
172
-
173
-
174
-
175
-
176
-
177
-
178
-
179
-
180
-
181
-
182
-
183
-
184
-
185
-
186
-
187
-
188
-
189
-
190
-
191
-
192
-
193
-
194
-
195
-
196
-
197
-
198
-
199
-
200
-
201
-
202
-
203
-
204
-
205
-
206
-
207
-
208
-
209
-
210
-
211
-
212
-
213
-
214
-
215
-
216
-
217
-
218
-
219
-
220
-
221
-
222
-
223
-
224
-
225
-
226
-
227
-
228
-
229
-
230
-
231
-
232
-
233
-
234
-
235
-
236
-
237
-
238
-
239
-
240
-
241
-
242
-
243
-
244
-
245
-
246
-
247
-
248
-
249
-
250
-
251
-
252
-
253
-
254
-
255
-
256
-
257
-
258
-
259
-
260
-
261
-
262
-
263
-
264
-
265
-
266
-
267
-
268
-
269
-
270
-
271
-
272
-
273
-
274
-
275
-
276
-
277
-
278
-
279
-
280
-
281
-
282
-
283
-
284
-
285
-
286
-
287
-
288
-
289
-
290
-
291
-
292
-
293
-
294
-
295
-
296
-
297
-
298
-
299
-
300
-
301
-
302
-
303
-
304
-
305
-
306
-
307
-
308
-
309
-
310
-
311
-
312
-
313
-
314
-
315
-
316
-
317
-
318
-
319
-
320
 |
 |
39
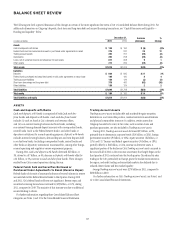
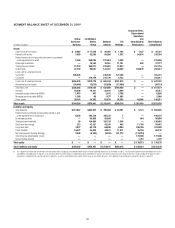
LIABILITIES
Deposits
Deposits represent customer funds that are payable on demand or upon
maturity. For a discussion of Citi’s deposits, see “Capital Resources and
Liquidity—Funding and Liquidity” below.
Federal Funds Purchased and Securities Loaned or Sold
Under Agreements To Repurchase (Repos)
Federal funds purchased consist of unsecured advances of excess balances in
reserve accounts held at the Federal Reserve Banks from third parties. During
2010 and 2011, Citi’s federal funds purchased were not significant.
For further information on Citi’s secured financing transactions,
including repos and securities lending transactions, see “Capital Resources
and Liquidity—Funding and Liquidity” below. See also Notes 1 and 12 to
the Consolidated Financial Statements for additional information on these
balance sheet categories.
Trading Account Liabilities
Trading account liabilities includes securities sold, not yet purchased
(short positions), and derivatives in a net payable position, as well as certain
liabilities that Citigroup has elected to carry at fair value.
During 2011, Trading account liabilities decreased by $3 billion, or
2%, primarily due to a $3 billion, or 6%, decrease in derivative liabilities. In
2011, average Trading account liabilities were $86 billion, compared to $80
billion in 2010.
For further information on Citi’s Trading account liabilities, see Notes 1
and 14 to the Consolidated Financial Statements.
Debt
Debt is composed of both short-term and long-term borrowings. Long-term
borrowings include senior notes, subordinated notes, trust preferred securities
and securitizations. Short-term borrowings include commercial paper and
borrowings from unaffiliated banks and other market participants. For
further information on Citi’s long-term and short-term debt borrowings
during 2011, see “Capital Resources and Liquidity—Funding and Liquidity”
below and Notes 1 and 19 to the Consolidated Financial Statements.
Other Liabilities
Other liabilities consists of Brokerage payables and Other liabilities
(including, among other items, accrued expenses and other payables,
deferred tax liabilities, certain end-user derivatives in a net payable position,
and reserves for legal claims, taxes, restructuring, unfunded lending
commitments, and other matters).
During 2011, Other liabilities increased $2 billion, or 2%, primarily due
to a $5 billion increase in Brokerage payables, offset by a $4 billion decrease
in Other liabilities.
For further information regarding Brokerage payables, see Note 13 to the
Consolidated Financial Statements.