Citibank 2011 Annual Report Download - page 225
Download and view the complete annual report
Please find page 225 of the 2011 Citibank annual report below. You can navigate through the pages in the report by either clicking on the pages listed below, or by using the keyword search tool below to find specific information within the annual report.-
 1
1 -
2
-
3
-
4
-
5
-
6
-
7
-
8
-
9
-
10
-
11
-
12
-
13
-
14
-
15
-
16
-
17
-
18
-
19
-
20
-
21
-
22
-
23
-
24
-
25
-
26
-
27
-
28
-
29
-
30
-
31
-
32
-
33
-
34
-
35
-
36
-
37
-
38
-
39
-
40
-
41
-
42
-
43
-
44
-
45
-
46
-
47
-
48
-
49
-
50
-
51
-
52
-
53
-
54
-
55
-
56
-
57
-
58
-
59
-
60
-
61
-
62
-
63
-
64
-
65
-
66
-
67
-
68
-
69
-
70
-
71
-
72
-
73
-
74
-
75
-
76
-
77
-
78
-
79
-
80
-
81
-
82
-
83
-
84
-
85
-
86
-
87
-
88
-
89
-
90
-
91
-
92
-
93
-
94
-
95
-
96
-
97
-
98
-
99
-
100
-
101
-
102
-
103
-
104
-
105
-
106
-
107
-
108
-
109
-
110
-
111
-
112
-
113
-
114
-
115
-
116
-
117
-
118
-
119
-
120
-
121
-
122
-
123
-
124
-
125
-
126
-
127
-
128
-
129
-
130
-
131
-
132
-
133
-
134
-
135
-
136
-
137
-
138
-
139
-
140
-
141
-
142
-
143
-
144
-
145
-
146
-
147
-
148
-
149
-
150
-
151
-
152
-
153
-
154
-
155
-
156
-
157
-
158
-
159
-
160
-
161
-
162
-
163
-
164
-
165
-
166
-
167
-
168
-
169
-
170
-
171
-
172
-
173
-
174
-
175
-
176
-
177
-
178
-
179
-
180
-
181
-
182
-
183
-
184
-
185
-
186
-
187
-
188
-
189
-
190
-
191
-
192
-
193
-
194
-
195
-
196
-
197
-
198
-
199
-
200
-
201
-
202
-
203
-
204
-
205
-
206
-
207
-
208
-
209
-
210
-
211
-
212
-
213
-
214
-
 215
215 -
 216
216 -
 217
217 -
 218
218 -
 219
219 -
 220
220 -
 221
221 -
 222
222 -
 223
223 -
 224
224 -
 225
225 -
 226
226 -
 227
227 -
 228
228 -
 229
229 -
 230
230 -
 231
231 -
 232
232 -
 233
233 -
 234
234 -
 235
235 -
236
-
237
-
238
-
239
-
240
-
241
-
242
-
243
-
244
-
245
-
246
-
247
-
248
-
249
-
250
-
251
-
252
-
253
-
254
-
255
-
256
-
257
-
258
-
259
-
260
-
261
-
262
-
263
-
264
-
265
-
266
-
267
-
268
-
269
-
270
-
271
-
272
-
273
-
274
-
275
-
276
-
277
-
278
-
279
-
280
-
281
-
282
-
283
-
284
-
285
-
286
-
287
-
288
-
289
-
290
-
291
-
292
-
293
-
294
-
295
-
296
-
297
-
298
-
299
-
300
-
301
-
302
-
303
-
304
-
305
-
306
-
307
-
308
-
309
-
310
-
311
-
312
-
313
-
314
-
315
-
316
-
317
-
318
-
319
-
320
 |
 |

203
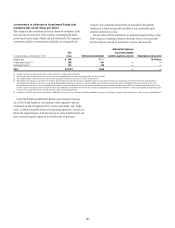
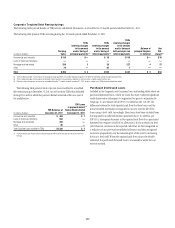
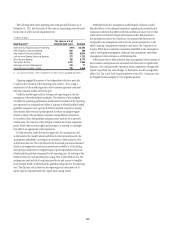
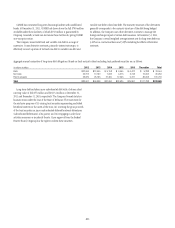
Corporate Troubled Debt Restructurings
The following tables provide details on TDR activity and default information as of and for the 12-month period ended December 31, 2011.
The following table presents TDRs occurring during the 12-month period ended December 31, 2011.
In millions of dollars
Carrying
Value
TDRs
involving changes
in the amount
and/or timing of
principal payments (1)
TDRs
involving changes
in the amount
and/or timing of
interest payments (2)
TDRs
involving changes
in the amount
and/or timing of
both principal and
interest payments
Balance of
principal forgiven
or deferred
Net
P&L
impact (3)
#OMMERCIALæANDæINDUSTRIAL $ 126 $— $ 16 $ 110 $— $ 16
,OANSæTOæFINANCIALæINSTITUTIONS — —————
-ORTGAGEæANDæREALæESTATE 250 3 20 227 4 37
/THER 74 — 67 7 — —
Total $ 450 $ 3 $ 103 $ 344 $ 4 $53
æ 4$2SæINVOLVINGæCHANGESæINæTHEæAMOUNTæORæTIMINGæOFæPRINCIPALæPAYMENTSæMAYæINVOLVEæPRINCIPALæFORGIVENESSæORæDEFERRALæOFæPERIODICæANDORæFINALæPRINCIPALæPAYMENTS
æ 4$2SæINVOLVINGæCHANGESæINæTHEæAMOUNTæORæTIMINGæOFæINTERESTæPAYMENTSæMAYæINVOLVEæAæREDUCTIONæINæINTERESTæRATEæORæAæBELOWMARKETæINTERESTæRATE
æ "ALANCESæREFLECTæCHARGEOFFSæANDæRESERVESæRECORDEDæDURINGæTHEææMONTHSæENDEDæ$ECEMBERæææONæLOANSæSUBJECTæTOæAæ4$2æDURINGæTHEæPERIODæTHENæENDED
The following table presents total corporate loans modified in a troubled
debt restructuring at December 31, 2011 as well as those TDRs that defaulted
during 2011 and for which the payment default occurred within one year of
the modification.
In millions of dollars
TDR Balances at
December 31, 2011
TDR Loans
in payment default
Twelve Months Ended
December 31, 2011
(1)
#OMMERCIALæANDæINDUSTRIAL $ 429 $ 7
,OANSæTOæFINANCIALæINSTITUTIONS 564 —
-ORTGAGEæANDæREALæESTATE 258 —
/THER 85 —
4OTALæ#ORPORATEæ,OANSæMODIFIEDæINæ4$2S $1,336 $ 7
æ 0AYMENTæDEFAULTæCONSTITUTESæFAILUREæTOæPAYæPRINCIPALæORæINTERESTæWHENæDUEæPERæTHEæCONTRACTUALæTERMSæOFæ
THEæLOAN
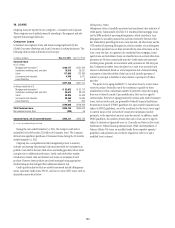
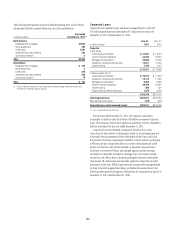
Purchased Distressed Loans
Included in the Corporate and Consumer loan outstanding tables above are
purchased distressed loans, which are loans that have evidenced significant
credit deterioration subsequent to origination but prior to acquisition by
Citigroup. In accordance with SOP 03-3 (codified as ASC 310-30), the
difference between the total expected cash flows for these loans and the
initial recorded investment is recognized in income over the life of the
loans using a level yield. Accordingly, these loans have been excluded from
the impaired loan table information presented above. In addition, per
SOP 03-3, subsequent decreases in the expected cash flows for a purchased
distressed loan require a build of an allowance so the loan retains its level
yield. However, increases in the expected cash flows are first recognized as
a reduction of any previously established allowance and then recognized
as income prospectively over the remaining life of the loan by increasing
the loan’s level yield. Where the expected cash flows cannot be reliably
estimated, the purchased distressed loan is accounted for under the cost
recovery method.