Citibank 2011 Annual Report Download - page 60
Download and view the complete annual report
Please find page 60 of the 2011 Citibank annual report below. You can navigate through the pages in the report by either clicking on the pages listed below, or by using the keyword search tool below to find specific information within the annual report.-
 1
1 -
2
-
3
-
4
-
5
-
6
-
7
-
8
-
9
-
10
-
11
-
12
-
13
-
14
-
15
-
16
-
17
-
18
-
19
-
20
-
21
-
22
-
23
-
24
-
25
-
26
-
27
-
28
-
29
-
30
-
31
-
32
-
33
-
34
-
35
-
36
-
37
-
38
-
39
-
40
-
41
-
42
-
43
-
44
-
45
-
46
-
47
-
48
-
49
-
 50
50 -
 51
51 -
 52
52 -
 53
53 -
 54
54 -
 55
55 -
 56
56 -
 57
57 -
 58
58 -
 59
59 -
 60
60 -
 61
61 -
 62
62 -
 63
63 -
 64
64 -
 65
65 -
 66
66 -
 67
67 -
 68
68 -
 69
69 -
 70
70 -
71
-
72
-
73
-
74
-
75
-
76
-
77
-
78
-
79
-
80
-
81
-
82
-
83
-
84
-
85
-
86
-
87
-
88
-
89
-
90
-
91
-
92
-
93
-
94
-
95
-
96
-
97
-
98
-
99
-
100
-
101
-
102
-
103
-
104
-
105
-
106
-
107
-
108
-
109
-
110
-
111
-
112
-
113
-
114
-
115
-
116
-
117
-
118
-
119
-
120
-
121
-
122
-
123
-
124
-
125
-
126
-
127
-
128
-
129
-
130
-
131
-
132
-
133
-
134
-
135
-
136
-
137
-
138
-
139
-
140
-
141
-
142
-
143
-
144
-
145
-
146
-
147
-
148
-
149
-
150
-
151
-
152
-
153
-
154
-
155
-
156
-
157
-
158
-
159
-
160
-
161
-
162
-
163
-
164
-
165
-
166
-
167
-
168
-
169
-
170
-
171
-
172
-
173
-
174
-
175
-
176
-
177
-
178
-
179
-
180
-
181
-
182
-
183
-
184
-
185
-
186
-
187
-
188
-
189
-
190
-
191
-
192
-
193
-
194
-
195
-
196
-
197
-
198
-
199
-
200
-
201
-
202
-
203
-
204
-
205
-
206
-
207
-
208
-
209
-
210
-
211
-
212
-
213
-
214
-
215
-
216
-
217
-
218
-
219
-
220
-
221
-
222
-
223
-
224
-
225
-
226
-
227
-
228
-
229
-
230
-
231
-
232
-
233
-
234
-
235
-
236
-
237
-
238
-
239
-
240
-
241
-
242
-
243
-
244
-
245
-
246
-
247
-
248
-
249
-
250
-
251
-
252
-
253
-
254
-
255
-
256
-
257
-
258
-
259
-
260
-
261
-
262
-
263
-
264
-
265
-
266
-
267
-
268
-
269
-
270
-
271
-
272
-
273
-
274
-
275
-
276
-
277
-
278
-
279
-
280
-
281
-
282
-
283
-
284
-
285
-
286
-
287
-
288
-
289
-
290
-
291
-
292
-
293
-
294
-
295
-
296
-
297
-
298
-
299
-
300
-
301
-
302
-
303
-
304
-
305
-
306
-
307
-
308
-
309
-
310
-
311
-
312
-
313
-
314
-
315
-
316
-
317
-
318
-
319
-
320
 |
 |
38
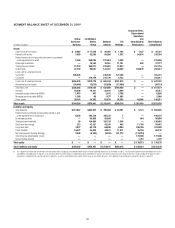
Investments
Investments consists of debt and equity securities that are available-for-sale,
debt securities that are held-to-maturity, non-marketable equity securities
that are carried at fair value, and non-marketable equity securities carried
at cost. Debt securities include bonds, notes and redeemable preferred stock,
as well as certain mortgage-backed and asset-backed securities and other
structured notes. Marketable and non-marketable equity securities carried
at fair value include common and nonredeemable preferred stock. Non-
marketable equity securities carried at cost primarily include equity shares
issued by the Federal Reserve Bank and the Federal Home Loan Banks that
Citigroup is required to hold.
During 2011, Investments decreased by $25 billion, or 8%, primarily due
to a $9 billion, or 3%, decrease in available-for-sale securities (predominantly
U.S. Treasury and federal agency securities), and a $18 billion decrease in
held-to-maturity securities (predominately mortgage-backed and Corporate
securities) that included the $12.7 billion of assets in the Special Asset Pool
that were reclassified and transferred to Trading account assets in the first
quarter of 2011. The majority of the remaining decrease was largely due to
a combined reduction in U.S. Treasury and federal agency securities and
foreign government securities, which was partially offset by an increase
in U.S. government agency mortgage-backed securities, as Citi began to
modestly reallocate its portfolio into higher-yielding assets.
For further information regarding Investments, see Notes 1 and 15 to the
Consolidated Financial Statements.
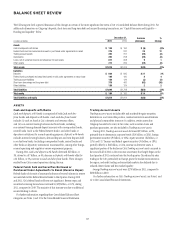
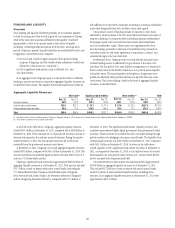
Loans
Loans represent the largest asset category of Citi’s balance sheet. Citi’s
total loans (as discussed throughout this section, net of unearned income)
were $647 billion at December 31, 2011, compared to $649 billion at
December 31, 2010. Excluding the impact of FX translation, loans increased
1% year over year. At year end 2011, Consumer and Corporate loans
represented 65% and 35%, respectively, of Citi’s total loans.
In Citicorp, loans have increased for six consecutive quarters as of
December 31, 2011, and were up 23% to $465 billion at year end 2011, as
compared to $379 billion at the second quarter of 2010. Citicorp Corporate
loans increased 24% year over year, and Citicorp Consumer loans were up 7%
year over year. Corporate loan growth was driven by Transaction Services
(37% growth), particularly from increased trade finance lending in Asia,
Latin America and Europe, as well as growth in the Securities and Banking
Corporate loan book (20% growth), with increased borrowing generally
across all client segments and geographies. Consumer loan growth was
driven by Regional Consumer Banking, as loans increased 7% year over
year, led by Asia and Latin America. The growth in Regional Consumer
Banking loans reflected the economic growth in these regions, as well as
the result of Citi’s investment spending in these areas, which drove growth in
both cards and retail loans. North America Consumer loans increased 6%,
driven by retail loans as the cards market continued to adapt to the CARD Act
and other regulatory changes. In contrast, Citi Holdings loans declined 25%
year over year, due to the continued run-off and asset sales in the portfolio.
During 2011, average loans of $644 billion yielded an average rate of
7.8%, compared to $686 billion and 8.0%, respectively, in the prior year.
For further information on Citi’s loan portfolios, see generally “Managing
Global Risk—Credit Risk” below and Notes 1 and 16 to the Consolidated
Financial Statements.
Other Assets
Other assets consists of Brokerage receivables, Goodwill, Intangibles and
Mortgage servicing rights in addition to Other assets (including, among
other items, loans held-for-sale, deferred tax assets, equity-method investments,
interest and fees receivable, premises and equipment, certain end-user
derivatives in a net receivable position, repossessed assets and other receivables).
During 2011, Other assets decreased $22 billion, or 9%, primarily due
to a $3 billion decrease in Brokerage receivables, a $2 billion decrease in
Mortgage servicing rights, a $1 billion decrease in Intangible assets, a $1
billion decrease in Goodwill and a $15 billion decrease in Other assets.
For further information on Brokerage receivables, see Note 13 to the
Consolidated Financial Statements. For further information regarding
Goodwill and Intangible assets, see Note 18 to the Consolidated
Financial Statements.