Citibank 2011 Annual Report Download - page 52
Download and view the complete annual report
Please find page 52 of the 2011 Citibank annual report below. You can navigate through the pages in the report by either clicking on the pages listed below, or by using the keyword search tool below to find specific information within the annual report.-
 1
1 -
2
-
3
-
4
-
5
-
6
-
7
-
8
-
9
-
10
-
11
-
12
-
13
-
14
-
15
-
16
-
17
-
18
-
19
-
20
-
21
-
22
-
23
-
24
-
25
-
26
-
27
-
28
-
29
-
30
-
31
-
32
-
33
-
34
-
35
-
36
-
37
-
38
-
39
-
40
-
41
-
 42
42 -
 43
43 -
 44
44 -
 45
45 -
 46
46 -
 47
47 -
 48
48 -
 49
49 -
 50
50 -
 51
51 -
 52
52 -
 53
53 -
 54
54 -
 55
55 -
 56
56 -
 57
57 -
 58
58 -
 59
59 -
 60
60 -
 61
61 -
 62
62 -
63
-
64
-
65
-
66
-
67
-
68
-
69
-
70
-
71
-
72
-
73
-
74
-
75
-
76
-
77
-
78
-
79
-
80
-
81
-
82
-
83
-
84
-
85
-
86
-
87
-
88
-
89
-
90
-
91
-
92
-
93
-
94
-
95
-
96
-
97
-
98
-
99
-
100
-
101
-
102
-
103
-
104
-
105
-
106
-
107
-
108
-
109
-
110
-
111
-
112
-
113
-
114
-
115
-
116
-
117
-
118
-
119
-
120
-
121
-
122
-
123
-
124
-
125
-
126
-
127
-
128
-
129
-
130
-
131
-
132
-
133
-
134
-
135
-
136
-
137
-
138
-
139
-
140
-
141
-
142
-
143
-
144
-
145
-
146
-
147
-
148
-
149
-
150
-
151
-
152
-
153
-
154
-
155
-
156
-
157
-
158
-
159
-
160
-
161
-
162
-
163
-
164
-
165
-
166
-
167
-
168
-
169
-
170
-
171
-
172
-
173
-
174
-
175
-
176
-
177
-
178
-
179
-
180
-
181
-
182
-
183
-
184
-
185
-
186
-
187
-
188
-
189
-
190
-
191
-
192
-
193
-
194
-
195
-
196
-
197
-
198
-
199
-
200
-
201
-
202
-
203
-
204
-
205
-
206
-
207
-
208
-
209
-
210
-
211
-
212
-
213
-
214
-
215
-
216
-
217
-
218
-
219
-
220
-
221
-
222
-
223
-
224
-
225
-
226
-
227
-
228
-
229
-
230
-
231
-
232
-
233
-
234
-
235
-
236
-
237
-
238
-
239
-
240
-
241
-
242
-
243
-
244
-
245
-
246
-
247
-
248
-
249
-
250
-
251
-
252
-
253
-
254
-
255
-
256
-
257
-
258
-
259
-
260
-
261
-
262
-
263
-
264
-
265
-
266
-
267
-
268
-
269
-
270
-
271
-
272
-
273
-
274
-
275
-
276
-
277
-
278
-
279
-
280
-
281
-
282
-
283
-
284
-
285
-
286
-
287
-
288
-
289
-
290
-
291
-
292
-
293
-
294
-
295
-
296
-
297
-
298
-
299
-
300
-
301
-
302
-
303
-
304
-
305
-
306
-
307
-
308
-
309
-
310
-
311
-
312
-
313
-
314
-
315
-
316
-
317
-
318
-
319
-
320
 |
 |

30
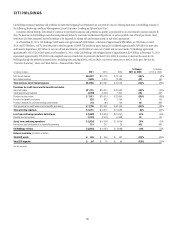
CITI HOLDINGS
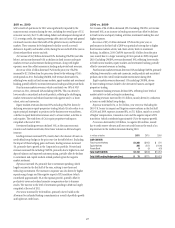
Citi Holdings contains businesses and portfolios of assets that Citigroup has determined are not central to its core Citicorp businesses. Citi Holdings consists of
the following: Brokerage and Asset Management, Local Consumer Lending and Special Asset Pool.
Consistent with its strategy, Citi intends to continue to exit these businesses and portfolios as quickly as practicable in an economically rational manner. To
date, the decrease in Citi Holdings assets has been primarily driven by asset sales and business dispositions, as well as portfolio run-off and pay-downs. Asset
levels have also been impacted, and will continue to be impacted, by charge-offs and revenue marks as and when appropriate.
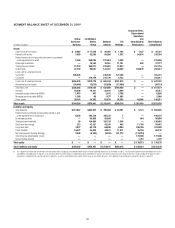
As of December 31, 2011, Citi Holdings’ GAAP assets were approximately $269 billion, a decrease of approximately $90 billion, or 25%, from year end
2010, and $558 billion, or 67%, from the peak in the first quarter of 2008. The decline in assets during 2011 reflected approximately $49 billion in asset sales
and business dispositions, $35 billion in net run-off and amortization, and $6 billion in net cost of credit and net asset marks. Citi Holdings represented
approximately 14% of Citi’s GAAP assets as of December 31, 2011, while Citi Holdings’ risk-weighted assets of approximately $245 billion at December 31, 2011
represented approximately 25% of Citi’s risk-weighted assets as of such date. As previously disclosed, Citi’s ability to continue to decrease the assets in Citi
Holdings through the methods discussed above, including sales and dispositions, will not likely occur at the same pace or level as in the past. See also the
“Executive Summary” above and “Risk Factors—Business Risks” below.
In millions of dollars 2011
% Change
2011 vs. 2010
æ#HANGEæ
æVSæ
.ETæINTERESTæREVENUE $10,287 æ (30)%
.ONINTERESTæREVENUE 2,609 (42)
Total revenues, net of interest expense $12,896 æ (33)%
Provisions for credit losses and for benefits and claims
.ETæCREDITæLOSSES $11,731 æ (38)%
#REDITæRESERVEæBUILDæRELEASE (4,720) (35) .-
0ROVISIONæFORæLOANæLOSSES $ 7,011 æ (55)%
0ROVISIONæFORæBENEFITSæANDæCLAIMS 820 1
0ROVISIONæRELEASEæFORæUNFUNDEDæLENDINGæCOMMITMENTS (41) 50 .-
4OTALæPROVISIONSæFORæCREDITæLOSSESæANDæFORæBENEFITSæANDæCLAIMS $ 7,790 æ (52)%
Total operating expenses $ 8,791 æ æ (9)%
Loss from continuing operations before taxes $ (3,685) 44%
"ENEFITSæFORæINCOMEæTAXES (1,161) 55
(Loss) from continuing operations $ (2,524) æ 38%
.ETæINCOMEæLOSSæATTRIBUTABLEæTOæNONCONTROLLINGæINTERESTS 119 (43) .-
Citi Holdings net loss $ (2,643) æ 38%
Balance sheet data (in billions of dollars)
Total EOP assets $ 269 æ æ (25)%
Total EOP deposits $ 64 æ æ (19)%
.-æ .OTæMEANINGFUL