Citibank 2011 Annual Report Download - page 102
Download and view the complete annual report
Please find page 102 of the 2011 Citibank annual report below. You can navigate through the pages in the report by either clicking on the pages listed below, or by using the keyword search tool below to find specific information within the annual report.-
 1
1 -
2
-
3
-
4
-
5
-
6
-
7
-
8
-
9
-
10
-
11
-
12
-
13
-
14
-
15
-
16
-
17
-
18
-
19
-
20
-
21
-
22
-
23
-
24
-
25
-
26
-
27
-
28
-
29
-
30
-
31
-
32
-
33
-
34
-
35
-
36
-
37
-
38
-
39
-
40
-
41
-
42
-
43
-
44
-
45
-
46
-
47
-
48
-
49
-
50
-
51
-
52
-
53
-
54
-
55
-
56
-
57
-
58
-
59
-
60
-
61
-
62
-
63
-
64
-
65
-
66
-
67
-
68
-
69
-
70
-
71
-
72
-
73
-
74
-
75
-
76
-
77
-
78
-
79
-
80
-
81
-
82
-
83
-
84
-
85
-
86
-
87
-
88
-
89
-
90
-
91
-
 92
92 -
 93
93 -
 94
94 -
 95
95 -
 96
96 -
 97
97 -
 98
98 -
 99
99 -
 100
100 -
 101
101 -
 102
102 -
 103
103 -
 104
104 -
 105
105 -
 106
106 -
 107
107 -
 108
108 -
 109
109 -
 110
110 -
 111
111 -
 112
112 -
113
-
114
-
115
-
116
-
117
-
118
-
119
-
120
-
121
-
122
-
123
-
124
-
125
-
126
-
127
-
128
-
129
-
130
-
131
-
132
-
133
-
134
-
135
-
136
-
137
-
138
-
139
-
140
-
141
-
142
-
143
-
144
-
145
-
146
-
147
-
148
-
149
-
150
-
151
-
152
-
153
-
154
-
155
-
156
-
157
-
158
-
159
-
160
-
161
-
162
-
163
-
164
-
165
-
166
-
167
-
168
-
169
-
170
-
171
-
172
-
173
-
174
-
175
-
176
-
177
-
178
-
179
-
180
-
181
-
182
-
183
-
184
-
185
-
186
-
187
-
188
-
189
-
190
-
191
-
192
-
193
-
194
-
195
-
196
-
197
-
198
-
199
-
200
-
201
-
202
-
203
-
204
-
205
-
206
-
207
-
208
-
209
-
210
-
211
-
212
-
213
-
214
-
215
-
216
-
217
-
218
-
219
-
220
-
221
-
222
-
223
-
224
-
225
-
226
-
227
-
228
-
229
-
230
-
231
-
232
-
233
-
234
-
235
-
236
-
237
-
238
-
239
-
240
-
241
-
242
-
243
-
244
-
245
-
246
-
247
-
248
-
249
-
250
-
251
-
252
-
253
-
254
-
255
-
256
-
257
-
258
-
259
-
260
-
261
-
262
-
263
-
264
-
265
-
266
-
267
-
268
-
269
-
270
-
271
-
272
-
273
-
274
-
275
-
276
-
277
-
278
-
279
-
280
-
281
-
282
-
283
-
284
-
285
-
286
-
287
-
288
-
289
-
290
-
291
-
292
-
293
-
294
-
295
-
296
-
297
-
298
-
299
-
300
-
301
-
302
-
303
-
304
-
305
-
306
-
307
-
308
-
309
-
310
-
311
-
312
-
313
-
314
-
315
-
316
-
317
-
318
-
319
-
320
 |
 |

80
In billions of dollars December 31, 2011 $ECEMBERææ
State (1) ENR (2)
ENR
Distribution
90+DPD
%
%
LTV >
100%
Refreshed
FICO %.2æ
%.2æ
$ISTRIBUTION
$0$æ
æ
,46ææ
2EFRESHEDæ
&)#/
#! $11.2 27% 2.3% 50% 721
.9.*#4 9.2 22 2.1 19 715
&, 2.8 7 3.3 69 698
), 1.6 4 2.3 62 705
)./(-) 1.5 4 2.6 66 678
!:.6 1.0 3 4.1 83 706
/THER 13.7 33 2.3 46 695
Total $41.0 100% 2.4% 45% 707
æ #ERTAINæOFæTHEæSTATESæAREæINCLUDEDæASæPARTæOFæAæREGIONæBASEDæONæ#ITISæVIEWæOFæSIMILARæHOMEæPRICESæ(0)æWITHINæTHEæREGION
æ %NDINGæNETæRECEIVABLESæ%XCLUDESæLOANSæINæ#ANADAæANDæ0UERTOæ2ICOæANDæLOANSæSUBJECTæTOæ,43#S
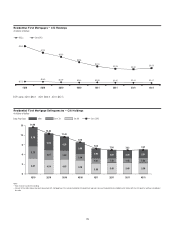
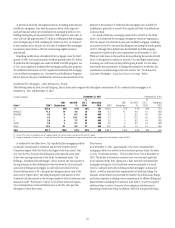
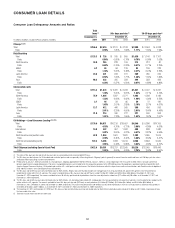
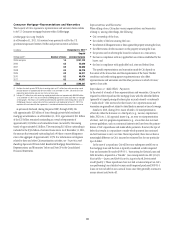
Similar to residential first mortgages (see “Residential First Mortgages—
State Delinquency Trends” above), at December 31, 2011, Citi’s home
equity loan portfolio was primarily concentrated in California and the
New York/New Jersey/Connecticut region. Year over year, 90+ days past
due delinquencies improved or remained stable across each of the states
and regions shown in the tables. See also “Consumer Mortgage FICO and
LTV” below.
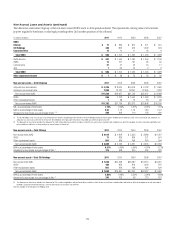
North America Consumer Mortgages – Loan Loss Reserve Coverage
At December 31, 2011, approximately $9.8 billion of Citi’s total loan loss
reserves of $30.1 billion was allocated to North America real estate lending
in Citi Holdings, representing approximately 31 months of coincident net
credit loss coverage as of such date. With respect to Citi’s aggregate North
America Consumer mortgage portfolio, including Citi Holdings as well as
the residential first mortgages and home equity loans in Citicorp, Citi’s loan
loss reserves of $10.0 billion at December 31, 2011 represented 30 months of
coincident net credit loss coverage.
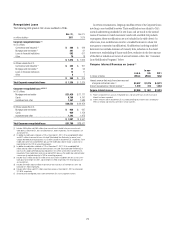
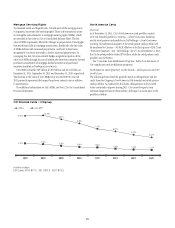
As evidenced by the tables above, the pace of improvement in home equity
loan delinquencies has slowed or remained flat. Given the lack of market in
which to sell delinquent home equity loans, as well as the relatively smaller
number of home equity loan modifications and modification programs,
Citi’s ability to offset increased delinquencies and net credit losses in its home
equity loan portfolio in Citi Holdings has been more limited as compared to
residential first mortgages, as discussed above. Accordingly, Citi could begin
to experience increased delinquencies and thus increased net credit losses
in this portfolio going forward. Citi has taken these trends and uncertainties
into consideration in determining its loan loss reserves. See “North America
Consumer Mortgages – Loan Loss Reserve Coverage” below.
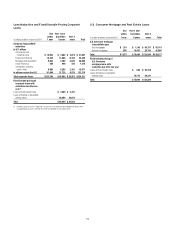
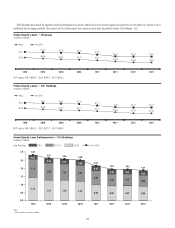
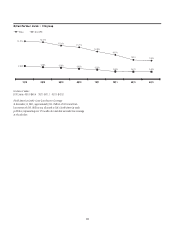
Home Equity Loans– State Delinquency Trends
The following tables set forth, for total Citigroup, the six states and/or regions
with the highest concentration of Citi’s home equity loans as of December 31,
2011 and December 31, 2010.
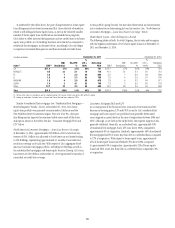
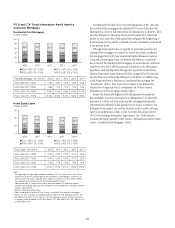
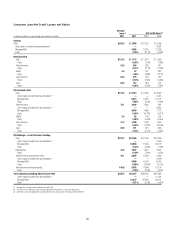
Consumer Mortgage FICO and LTV
As a consequence of the financial crisis, economic environment and the
decrease in housing prices, LTV and FICO scores for Citi’s residential first
mortgage and home equity loan portfolios have generally deteriorated
since origination, particularly in the case of originations between 2006 and
2007, although, as set forth in the tables below, the negative migration has
generally stabilized. Generally, on a refreshed basis, approximately 30%
of residential first mortgages had a LTV ratio above 100%, compared to
approximately 0% at origination. Similarly, approximately 36% of residential
first mortgages had FICO scores less than 660 on a refreshed basis, compared
to 27% at origination. With respect to home equity loans, approximately
45% of home equity loans had refreshed LTVs above 100%, compared
to approximately 0% at origination. Approximately 24% of home equity
loans had FICO scores less than 660 on a refreshed basis, compared to 9%
at origination.