Citibank 2011 Annual Report Download - page 206
Download and view the complete annual report
Please find page 206 of the 2011 Citibank annual report below. You can navigate through the pages in the report by either clicking on the pages listed below, or by using the keyword search tool below to find specific information within the annual report.-
 1
1 -
2
-
3
-
4
-
5
-
6
-
7
-
8
-
9
-
10
-
11
-
12
-
13
-
14
-
15
-
16
-
17
-
18
-
19
-
20
-
21
-
22
-
23
-
24
-
25
-
26
-
27
-
28
-
29
-
30
-
31
-
32
-
33
-
34
-
35
-
36
-
37
-
38
-
39
-
40
-
41
-
42
-
43
-
44
-
45
-
46
-
47
-
48
-
49
-
50
-
51
-
52
-
53
-
54
-
55
-
56
-
57
-
58
-
59
-
60
-
61
-
62
-
63
-
64
-
65
-
66
-
67
-
68
-
69
-
70
-
71
-
72
-
73
-
74
-
75
-
76
-
77
-
78
-
79
-
80
-
81
-
82
-
83
-
84
-
85
-
86
-
87
-
88
-
89
-
90
-
91
-
92
-
93
-
94
-
95
-
96
-
97
-
98
-
99
-
100
-
101
-
102
-
103
-
104
-
105
-
106
-
107
-
108
-
109
-
110
-
111
-
112
-
113
-
114
-
115
-
116
-
117
-
118
-
119
-
120
-
121
-
122
-
123
-
124
-
125
-
126
-
127
-
128
-
129
-
130
-
131
-
132
-
133
-
134
-
135
-
136
-
137
-
138
-
139
-
140
-
141
-
142
-
143
-
144
-
145
-
146
-
147
-
148
-
149
-
150
-
151
-
152
-
153
-
154
-
155
-
156
-
157
-
158
-
159
-
160
-
161
-
162
-
163
-
164
-
165
-
166
-
167
-
168
-
169
-
170
-
171
-
172
-
173
-
174
-
175
-
176
-
177
-
178
-
179
-
180
-
181
-
182
-
183
-
184
-
185
-
186
-
187
-
188
-
189
-
190
-
191
-
192
-
193
-
194
-
195
-
 196
196 -
 197
197 -
 198
198 -
 199
199 -
 200
200 -
 201
201 -
 202
202 -
 203
203 -
 204
204 -
 205
205 -
 206
206 -
 207
207 -
 208
208 -
 209
209 -
 210
210 -
 211
211 -
 212
212 -
 213
213 -
 214
214 -
 215
215 -
 216
216 -
217
-
218
-
219
-
220
-
221
-
222
-
223
-
224
-
225
-
226
-
227
-
228
-
229
-
230
-
231
-
232
-
233
-
234
-
235
-
236
-
237
-
238
-
239
-
240
-
241
-
242
-
243
-
244
-
245
-
246
-
247
-
248
-
249
-
250
-
251
-
252
-
253
-
254
-
255
-
256
-
257
-
258
-
259
-
260
-
261
-
262
-
263
-
264
-
265
-
266
-
267
-
268
-
269
-
270
-
271
-
272
-
273
-
274
-
275
-
276
-
277
-
278
-
279
-
280
-
281
-
282
-
283
-
284
-
285
-
286
-
287
-
288
-
289
-
290
-
291
-
292
-
293
-
294
-
295
-
296
-
297
-
298
-
299
-
300
-
301
-
302
-
303
-
304
-
305
-
306
-
307
-
308
-
309
-
310
-
311
-
312
-
313
-
314
-
315
-
316
-
317
-
318
-
319
-
320
 |
 |

184
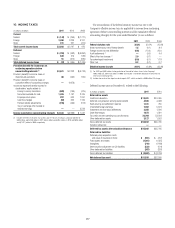
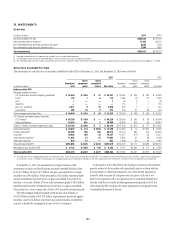
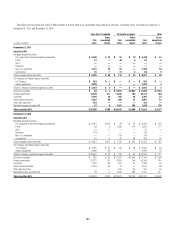
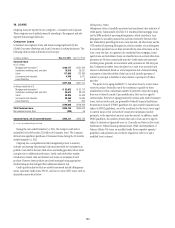
15. INVESTMENTS
Overview
In millions of dollars 2011
3ECURITIESæAVAILABLEFORSALE $265,204
$EBTæSECURITIESæHELDTOMATURITYæ 11,483
.ONMARKETABLEæEQUITYæSECURITIESæCARRIEDæATæFAIRæVALUEæ 8,836
.ONMARKETABLEæEQUITYæSECURITIESæCARRIEDæATæCOSTæ 7,890
Total investments $293,413
æ 2ECORDEDæATæAMORTIZEDæCOSTæLESSæIMPAIRMENTæFORæSECURITIESæTHATæHAVEæCREDITRELATEDæIMPAIRMENT
æ 5NREALIZEDæGAINSæANDæLOSSESæFORæNONMARKETABLEæEQUITYæSECURITIESæCARRIEDæATæFAIRæVALUEæAREæRECOGNIZEDæINæEARNINGS
æ .ONMARKETABLEæEQUITYæSECURITIESæCARRIEDæATæCOSTæPRIMARILYæCONSISTæOFæSHARESæISSUEDæBYæTHEæ&EDERALæ2ESERVEæ"ANKæ&EDERALæ(OMEæ,OANæ"ANKSæFOREIGNæCENTRALæBANKSæANDæVARIOUSæCLEARINGæHOUSESæOFæWHICHæ#ITIGROUPæISæAæMEMBER
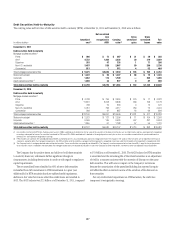
Securities Available-for-Sale
The amortized cost and fair value of securities available-for-sale (AFS) at December 31, 2011 and December 31, 2010 were as follows:
2011
In millions of dollars
Amortized
cost
Gross
unrealized
gains
Gross
unrealized
losses Fair value
!MORTIZEDæ
COST
'ROSSæ
UNREALIZEDæ
GAINS
'ROSSæ
UNREALIZEDæ
LOSSES &AIRæVALUE
Debt securities AFS
-ORTGAGEBACKEDæSECURITIESæ
53æGOVERNMENTSPONSOREDæAGENCYæGUARANTEED $ 44,394 $ 1,438 $ 51 $ 45,781
0RIME 118 1 6 113
!LT! 1—— 1
3UBPRIME ————
.ON53æRESIDENTIAL 4,671 9 22 4,658
#OMMERCIAL 465 16 9 472
4OTALæMORTGAGEBACKEDæSECURITIES $ 49,649 $ 1,464 $ 88 $ 51,025
53æ4REASURYæANDæFEDERALæAGENCYæSECURITIES
53æ4REASURY $ 48,790 $ 1,439 $ — $ 50,229
!GENCYæOBLIGATIONS 34,310 601 2 34,909
4OTALæ53æ4REASURYæANDæFEDERALæAGENCYæSECURITIES $ 83,100 $ 2,040 $ 2 $ 85,138
3TATEæANDæMUNICIPAL $ 16,819 $ 134 $ 2,554 $ 14,399
&OREIGNæGOVERNMENT 84,360 558 404 84,514
#ORPORATE 10,005 305 53 10,257
!SSETBACKEDæSECURITIESæ 11,053 31 81 11,003
/THERæDEBTæSECURITIES 670 13 — 683
4OTALæDEBTæSECURITIESæ!&3 $255,656 $ 4,545 $ 3,182 $257,019
-ARKETABLEæEQUITYæSECURITIESæ!&3 $ 6,722 $ 1,658 $ 195 $ 8,185
Total securities AFS $262,378 $ 6,203 $ 3,377 $265,204
ææ 4HEæ#OMPANYæINVESTSæINæMORTGAGEBACKEDæANDæASSETBACKEDæSECURITIESæ4HESEæSECURITIZATIONSæAREæGENERALLYæCONSIDEREDæ6)%Sæ4HEæ#OMPANYSæMAXIMUMæEXPOSUREæTOæLOSSæFROMæTHESEæ6)%SæISæEQUALæTOæTHEæCARRYINGæAMOUNTæ
OFæTHEæSECURITIESæWHICHæISæREFLECTEDæINæTHEæTABLEæABOVEæ&ORæMORTGAGEBACKEDæANDæASSETBACKEDæSECURITIZATIONSæINæWHICHæTHEæ#OMPANYæHASæOTHERæINVOLVEMENTæSEEæ.OTEææTOæTHEæ#ONSOLIDATEDæ&INANCIALæ3TATEMENTS
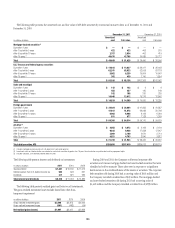
At December 31, 2011, the amortized cost of approximately 4,000
investments in equity and fixed-income securities exceeded their fair value
by $3.377 billion. Of the $3.377 billion, the gross unrealized loss on equity
securities was $195 million. Of the remainder, $362 million represents fixed-
income investments that have been in a gross-unrealized-loss position for
less than a year and, of these, 99% are rated investment grade; $2.820 billion
represents fixed-income investments that have been in a gross-unrealized-
loss position for a year or more and, of these, 95% are rated investment grade.
The AFS mortgage-backed securities portfolio fair value balance of
$51.025 billion consists of $45.781 billion of government-sponsored agency
securities, and $5.244 billion of privately sponsored securities, of which the
majority is backed by mortgages that are not Alt-A or subprime.
As discussed in more detail below, the Company conducts and documents
periodic reviews of all securities with unrealized losses to evaluate whether
the impairment is other than temporary. Any credit-related impairment
related to debt securities the Company does not plan to sell and is not
likely to be required to sell is recognized in the Consolidated Statement of
Income, with the non-credit-related impairment recognized in AOCI. For
other impaired debt securities, the entire impairment is recognized in the
Consolidated Statement of Income.