Citibank 2011 Annual Report Download - page 274
Download and view the complete annual report
Please find page 274 of the 2011 Citibank annual report below. You can navigate through the pages in the report by either clicking on the pages listed below, or by using the keyword search tool below to find specific information within the annual report.-
 1
1 -
2
-
3
-
4
-
5
-
6
-
7
-
8
-
9
-
10
-
11
-
12
-
13
-
14
-
15
-
16
-
17
-
18
-
19
-
20
-
21
-
22
-
23
-
24
-
25
-
26
-
27
-
28
-
29
-
30
-
31
-
32
-
33
-
34
-
35
-
36
-
37
-
38
-
39
-
40
-
41
-
42
-
43
-
44
-
45
-
46
-
47
-
48
-
49
-
50
-
51
-
52
-
53
-
54
-
55
-
56
-
57
-
58
-
59
-
60
-
61
-
62
-
63
-
64
-
65
-
66
-
67
-
68
-
69
-
70
-
71
-
72
-
73
-
74
-
75
-
76
-
77
-
78
-
79
-
80
-
81
-
82
-
83
-
84
-
85
-
86
-
87
-
88
-
89
-
90
-
91
-
92
-
93
-
94
-
95
-
96
-
97
-
98
-
99
-
100
-
101
-
102
-
103
-
104
-
105
-
106
-
107
-
108
-
109
-
110
-
111
-
112
-
113
-
114
-
115
-
116
-
117
-
118
-
119
-
120
-
121
-
122
-
123
-
124
-
125
-
126
-
127
-
128
-
129
-
130
-
131
-
132
-
133
-
134
-
135
-
136
-
137
-
138
-
139
-
140
-
141
-
142
-
143
-
144
-
145
-
146
-
147
-
148
-
149
-
150
-
151
-
152
-
153
-
154
-
155
-
156
-
157
-
158
-
159
-
160
-
161
-
162
-
163
-
164
-
165
-
166
-
167
-
168
-
169
-
170
-
171
-
172
-
173
-
174
-
175
-
176
-
177
-
178
-
179
-
180
-
181
-
182
-
183
-
184
-
185
-
186
-
187
-
188
-
189
-
190
-
191
-
192
-
193
-
194
-
195
-
196
-
197
-
198
-
199
-
200
-
201
-
202
-
203
-
204
-
205
-
206
-
207
-
208
-
209
-
210
-
211
-
212
-
213
-
214
-
215
-
216
-
217
-
218
-
219
-
220
-
221
-
222
-
223
-
224
-
225
-
226
-
227
-
228
-
229
-
230
-
231
-
232
-
233
-
234
-
235
-
236
-
237
-
238
-
239
-
240
-
241
-
242
-
243
-
244
-
245
-
246
-
247
-
248
-
249
-
250
-
251
-
252
-
253
-
254
-
255
-
256
-
257
-
258
-
259
-
260
-
261
-
262
-
263
-
 264
264 -
 265
265 -
 266
266 -
 267
267 -
 268
268 -
 269
269 -
 270
270 -
 271
271 -
 272
272 -
 273
273 -
 274
274 -
 275
275 -
 276
276 -
 277
277 -
 278
278 -
 279
279 -
 280
280 -
 281
281 -
 282
282 -
 283
283 -
 284
284 -
285
-
286
-
287
-
288
-
289
-
290
-
291
-
292
-
293
-
294
-
295
-
296
-
297
-
298
-
299
-
300
-
301
-
302
-
303
-
304
-
305
-
306
-
307
-
308
-
309
-
310
-
311
-
312
-
313
-
314
-
315
-
316
-
317
-
318
-
319
-
320
 |
 |

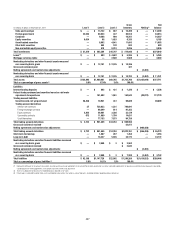
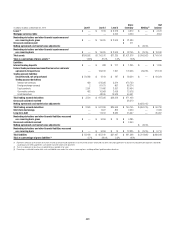
252
In millions of dollars
December 31,
2009
Net realized/unrealized
gains (losses) included in
(1)(2)
Transfers
in and/or
out of
Level 3
Purchases,
issuances
and
settlements
December 31,
2010
Unrealized
gains
(losses)
still held (3)
Principal
transactions Other
Investments
Mortgage-backed securities
53æGOVERNMENTSPONSOREDæAGENCYæGUARANTEED
0RIME
!LT!
3UBPRIME
#OMMERCIAL
Total investment mortgage-backed
debt securities
U.S. Treasury and federal agency securities
State and municipal
Foreign government
Corporate
Equity securities
Asset-backed securities
Other debt securities
Non-marketable equity securities
Total investments
Loans
Mortgage servicing rights
Other financial assets measured on a
recurring basis
Liabilities
Interest-bearing deposits
Federal funds purchased and securities
loaned or sold under agreements to
repurchase
Trading account liabilities
3ECURITIESæSOLDæNOTæYETæPURCHASED
Short-term borrowings
Long-term debt
Other financial liabilities measured on a
recurring basis
æ #HANGESæINæFAIRæVALUEæFORæAVAILABLEFORSALEæINVESTMENTSæDEBTæSECURITIESæAREæRECORDEDæINæAccumulated other comprehensive income (loss)æWHILEæGAINSæANDæLOSSESæFROMæSALESæAREæRECORDEDæINæRealized gains (losses) from
sales of investmentsæONæTHEæ#ONSOLIDATEDæ3TATEMENTæOFæ)NCOMEæ
æ 5NREALIZEDæGAINSæLOSSESæONæ-32SæAREæRECORDEDæINæOther revenueæONæTHEæ#ONSOLIDATEDæ3TATEMENTæOFæ)NCOMEæ
æ 2EPRESENTSæTHEæAMOUNTæOFæTOTALæGAINSæORæLOSSESæFORæTHEæPERIODæINCLUDEDæINæEARNINGSæANDæAccumulated other comprehensive income (loss) FORæCHANGESæINæFAIRæVALUEæFORæAVAILABLEFORSALEæINVESTMENTSæATTRIBUTABLEæTOæTHEæ
CHANGEæINæFAIRæVALUEæRELATINGæTOæASSETSæANDæLIABILITIESæCLASSIFIEDæASæ,EVELææTHATæAREæSTILLæHELDæATæ$ECEMBERæææANDææ
æ 4OTALæ,EVELææDERIVATIVEæASSETSæANDæLIABILITIESæHAVEæBEENæNETTEDæINæTHESEæTABLESæFORæPRESENTATIONæPURPOSESæONLY
æ 2EFLECTSæTHEæRECLASSIFICATIONæOFææMILLIONæOFæSTRUCTUREDæREVERSEæREPOSæFROMæFederal funds purchased and securities loaned or sold under agreements to repurchase to Federal funds sold and securities borrowed or
purchased under agreements to resellæ4HESEæSTRUCTUREDæREVERSEæREPOSæASSETSæWEREæINCORRECTLYæCLASSIFIEDæINææBUTæWEREæCORRECTLYæCLASSIFIEDæONæ#ITISæ#ONSOLIDATEDæ"ALANCEæ3HEETæFORæALLæPERIODS
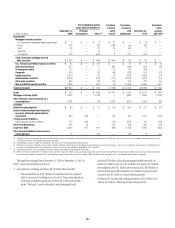
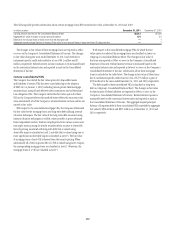
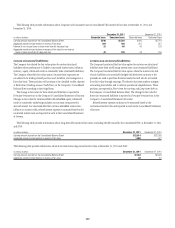
The significant changes from December 31, 2010 to December 31, 2011 in
Level 3 assets and liabilities were due to:
A net decrease in trading securities of $3.9 billion that included:
The reclassification of $4.3 billion of securities from – Investments
held-to-maturity to Trading account assets. These reclassifications
have been included in purchases in the Level 3 roll-forward table
above. The Level 3 assets reclassified, and subsequently sold,
included $2.8 billion of trading mortgage-backed securities (of
which $1.5 billion were Alt-A, $1.0 billion were prime, $0.2 billion
were subprime and $0.1 billion were commercial), $0.9 billion of
state and municipal debt securities, $0.3 billion of corporate debt
securities and $0.2 billion of asset-backed securities.
Purchases of corporate debt trading securities of $3.0 billion and –
sales of $3.6 billion, reflecting strong trading activity.