Citibank 2011 Annual Report Download - page 199
Download and view the complete annual report
Please find page 199 of the 2011 Citibank annual report below. You can navigate through the pages in the report by either clicking on the pages listed below, or by using the keyword search tool below to find specific information within the annual report.-
 1
1 -
2
-
3
-
4
-
5
-
6
-
7
-
8
-
9
-
10
-
11
-
12
-
13
-
14
-
15
-
16
-
17
-
18
-
19
-
20
-
21
-
22
-
23
-
24
-
25
-
26
-
27
-
28
-
29
-
30
-
31
-
32
-
33
-
34
-
35
-
36
-
37
-
38
-
39
-
40
-
41
-
42
-
43
-
44
-
45
-
46
-
47
-
48
-
49
-
50
-
51
-
52
-
53
-
54
-
55
-
56
-
57
-
58
-
59
-
60
-
61
-
62
-
63
-
64
-
65
-
66
-
67
-
68
-
69
-
70
-
71
-
72
-
73
-
74
-
75
-
76
-
77
-
78
-
79
-
80
-
81
-
82
-
83
-
84
-
85
-
86
-
87
-
88
-
89
-
90
-
91
-
92
-
93
-
94
-
95
-
96
-
97
-
98
-
99
-
100
-
101
-
102
-
103
-
104
-
105
-
106
-
107
-
108
-
109
-
110
-
111
-
112
-
113
-
114
-
115
-
116
-
117
-
118
-
119
-
120
-
121
-
122
-
123
-
124
-
125
-
126
-
127
-
128
-
129
-
130
-
131
-
132
-
133
-
134
-
135
-
136
-
137
-
138
-
139
-
140
-
141
-
142
-
143
-
144
-
145
-
146
-
147
-
148
-
149
-
150
-
151
-
152
-
153
-
154
-
155
-
156
-
157
-
158
-
159
-
160
-
161
-
162
-
163
-
164
-
165
-
166
-
167
-
168
-
169
-
170
-
171
-
172
-
173
-
174
-
175
-
176
-
177
-
178
-
179
-
180
-
181
-
182
-
183
-
184
-
185
-
186
-
187
-
188
-
 189
189 -
 190
190 -
 191
191 -
 192
192 -
 193
193 -
 194
194 -
 195
195 -
 196
196 -
 197
197 -
 198
198 -
 199
199 -
 200
200 -
 201
201 -
 202
202 -
 203
203 -
 204
204 -
 205
205 -
 206
206 -
 207
207 -
 208
208 -
 209
209 -
210
-
211
-
212
-
213
-
214
-
215
-
216
-
217
-
218
-
219
-
220
-
221
-
222
-
223
-
224
-
225
-
226
-
227
-
228
-
229
-
230
-
231
-
232
-
233
-
234
-
235
-
236
-
237
-
238
-
239
-
240
-
241
-
242
-
243
-
244
-
245
-
246
-
247
-
248
-
249
-
250
-
251
-
252
-
253
-
254
-
255
-
256
-
257
-
258
-
259
-
260
-
261
-
262
-
263
-
264
-
265
-
266
-
267
-
268
-
269
-
270
-
271
-
272
-
273
-
274
-
275
-
276
-
277
-
278
-
279
-
280
-
281
-
282
-
283
-
284
-
285
-
286
-
287
-
288
-
289
-
290
-
291
-
292
-
293
-
294
-
295
-
296
-
297
-
298
-
299
-
300
-
301
-
302
-
303
-
304
-
305
-
306
-
307
-
308
-
309
-
310
-
311
-
312
-
313
-
314
-
315
-
316
-
317
-
318
-
319
-
320
 |
 |

177
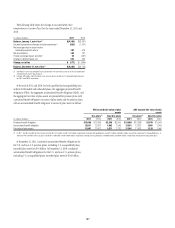
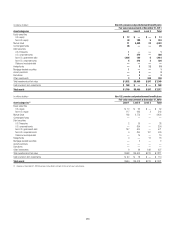
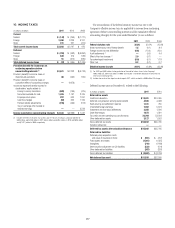
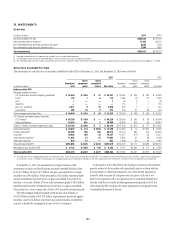
10. INCOME TAXES
In millions of dollars 2011
Current æ
&EDERAL $ (144)
&OREIGN 3,498
3TATE 241
Total current income taxes $ 3,595
Deferred
&EDERAL $ (793)
&OREIGN 628
3TATE 91
Total deferred income taxes $ (74)
Provision (benefit) for income tax on
continuing operations before
noncontrolling interests (1) $ 3,521
0ROVISIONæBENEFITæFORæINCOMEæTAXESæONææ
DISCONTINUEDæOPERATIONS 66
0ROVISIONæBENEFITæFORæINCOMEæTAXESæONææ
CUMULATIVEæEFFECTæOFæACCOUNTINGæCHANGES —
)NCOMEæTAXæEXPENSEæBENEFITæREPORTEDæINæ
STOCKHOLDERSæEQUITYæRELATEDæTO
&OREIGNæCURRENCYæTRANSLATION (609)
3ECURITIESæAVAILABLEFORSALE 1,495
%MPLOYEEæSTOCKæPLANS 297
#ASHæFLOWæHEDGES (92)
0ENSIONæLIABILITYæADJUSTMENTS (235)
4AXæONæEXCHANGEæOFFERæBOOKEDæTOæ
RETAINEDæEARNINGS —
Income taxes before noncontrolling interests $ 4,443
æ )NCLUDESæTHEæEFFECTæOFæSECURITIESæTRANSACTIONSæANDæ/44)æLOSSESæRESULTINGæINæAæPROVISIONæBENEFITæOFæ
æMILLIONæANDææMILLIONæINæææMILLIONæANDææMILLIONæINææANDææMILLIONæ
ANDææMILLIONæINææRESPECTIVELYæ
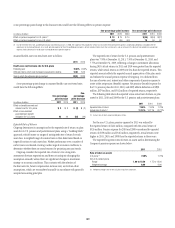
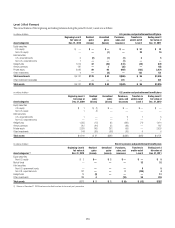
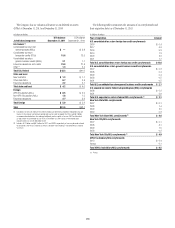
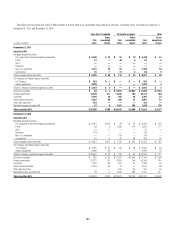
The reconciliation of the federal statutory income tax rate to the
Company’s effective income tax rate applicable to income from continuing
operations (before noncontrolling interests and the cumulative effect of
accounting changes) for the years ended December 31 was as follows:
2011
Federal statutory rate 35.0%
3TATEæINCOMEæTAXESæNETæOFæFEDERALæBENEFITæ 1.5 æ
&OREIGNæINCOMEæTAXæRATEæDIFFERENTIAL (8.6) æ
!UDITæSETTLEMENTSæ —
%FFECTæOFæTAXæLAWæCHANGESæ 2.0
4AXæADVANTAGEDæINVESTMENTS (6.0)
/THERæNET 0.2
Effective income tax rate 24.1%
æ &ORææANDææRELATESæTOæTHEæCONCLUSIONæOFæTHEæAUDITæOFæVARIOUSæISSUESæINæTHEæ#OMPANYSæ
næ53æFEDERALæTAXæAUDITæ&ORææALSOæINCLUDESæAæTAXæBENEFITæRELATINGæTOæTHEæRELEASEæOFæTAXæ
RESERVESæONæINTERCHANGEæFEESæ
æ )NCLUDESæTHEæRESULTSæOFæTHEæ*APANæTAXæRATEæCHANGEæINææWHICHæRESULTEDæINæAææMILLIONæ$4!æCHARGE
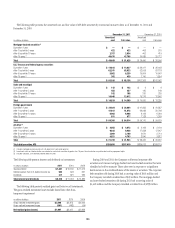
Deferred income taxes at December 31 related to the following:
In millions of dollars 2011
Deferred tax assets
#REDITæLOSSæDEDUCTION $ 12,481
$EFERREDæCOMPENSATIONæANDæEMPLOYEEæBENEFITS 4,936
2ESTRUCTURINGæANDæSETTLEMENTæRESERVES 1,331
5NREMITTEDæFOREIGNæEARNINGS 7,362
)NVESTMENTæANDæLOANæBASISæDIFFERENCES 2,358
#ASHæFLOWæHEDGES 1,673
4AXæCREDITæANDæNETæOPERATINGæLOSSæCARRYFORWARDS 22,764
/THERæDEFERREDæTAXæASSETSæ 2,127
'ROSSæDEFERREDæTAXæASSETS $ 55,032
6ALUATIONæALLOWANCE —
Deferred tax assets after valuation allowance $ 55,032
Deferred tax liabilities
$EFERREDæPOLICYæACQUISITIONæCOSTSææ
ANDæVALUEæOFæINSURANCEæINæFORCE $ (591)
&IXEDæASSETSæANDæLEASES (1,361)
)NTANGIBLES (710)
$EBTæVALUATIONæADJUSTMENTæONæ#ITIæLIABILITIES (533)
/THERæDEFERREDæTAXæLIABILITIES (307)
'ROSSæDEFERREDæTAXæLIABILITIES $ (3,502)
Net deferred tax asset $ 51,530