Citibank 2011 Annual Report Download - page 155
Download and view the complete annual report
Please find page 155 of the 2011 Citibank annual report below. You can navigate through the pages in the report by either clicking on the pages listed below, or by using the keyword search tool below to find specific information within the annual report.-
 1
1 -
2
-
3
-
4
-
5
-
6
-
7
-
8
-
9
-
10
-
11
-
12
-
13
-
14
-
15
-
16
-
17
-
18
-
19
-
20
-
21
-
22
-
23
-
24
-
25
-
26
-
27
-
28
-
29
-
30
-
31
-
32
-
33
-
34
-
35
-
36
-
37
-
38
-
39
-
40
-
41
-
42
-
43
-
44
-
45
-
46
-
47
-
48
-
49
-
50
-
51
-
52
-
53
-
54
-
55
-
56
-
57
-
58
-
59
-
60
-
61
-
62
-
63
-
64
-
65
-
66
-
67
-
68
-
69
-
70
-
71
-
72
-
73
-
74
-
75
-
76
-
77
-
78
-
79
-
80
-
81
-
82
-
83
-
84
-
85
-
86
-
87
-
88
-
89
-
90
-
91
-
92
-
93
-
94
-
95
-
96
-
97
-
98
-
99
-
100
-
101
-
102
-
103
-
104
-
105
-
106
-
107
-
108
-
109
-
110
-
111
-
112
-
113
-
114
-
115
-
116
-
117
-
118
-
119
-
120
-
121
-
122
-
123
-
124
-
125
-
126
-
127
-
128
-
129
-
130
-
131
-
132
-
133
-
134
-
135
-
136
-
137
-
138
-
139
-
140
-
141
-
142
-
143
-
144
-
 145
145 -
 146
146 -
 147
147 -
 148
148 -
 149
149 -
 150
150 -
 151
151 -
 152
152 -
 153
153 -
 154
154 -
 155
155 -
 156
156 -
 157
157 -
 158
158 -
 159
159 -
 160
160 -
 161
161 -
 162
162 -
 163
163 -
 164
164 -
 165
165 -
166
-
167
-
168
-
169
-
170
-
171
-
172
-
173
-
174
-
175
-
176
-
177
-
178
-
179
-
180
-
181
-
182
-
183
-
184
-
185
-
186
-
187
-
188
-
189
-
190
-
191
-
192
-
193
-
194
-
195
-
196
-
197
-
198
-
199
-
200
-
201
-
202
-
203
-
204
-
205
-
206
-
207
-
208
-
209
-
210
-
211
-
212
-
213
-
214
-
215
-
216
-
217
-
218
-
219
-
220
-
221
-
222
-
223
-
224
-
225
-
226
-
227
-
228
-
229
-
230
-
231
-
232
-
233
-
234
-
235
-
236
-
237
-
238
-
239
-
240
-
241
-
242
-
243
-
244
-
245
-
246
-
247
-
248
-
249
-
250
-
251
-
252
-
253
-
254
-
255
-
256
-
257
-
258
-
259
-
260
-
261
-
262
-
263
-
264
-
265
-
266
-
267
-
268
-
269
-
270
-
271
-
272
-
273
-
274
-
275
-
276
-
277
-
278
-
279
-
280
-
281
-
282
-
283
-
284
-
285
-
286
-
287
-
288
-
289
-
290
-
291
-
292
-
293
-
294
-
295
-
296
-
297
-
298
-
299
-
300
-
301
-
302
-
303
-
304
-
305
-
306
-
307
-
308
-
309
-
310
-
311
-
312
-
313
-
314
-
315
-
316
-
317
-
318
-
319
-
320
 |
 |

133
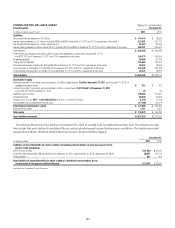
CONSOLIDATED BALANCE SHEET Citigroup Inc. and Subsidiaries
(Continued) December 31,
In millions of dollars, except shares 2011
Liabilities
.ONINTERESTBEARINGæDEPOSITSæINæ53æOFFICES $ 119,437
)NTERESTBEARINGæDEPOSITSæINæ53æOFFICESæINCLUDINGææANDææATæ$ECEMBERæææANDææRESPECTIVELYæATæFAIRæVALUE 223,851
.ONINTERESTBEARINGæDEPOSITSæINæOFFICESæOUTSIDEæTHEæ53 57,357
)NTERESTBEARINGæDEPOSITSæINæOFFICESæOUTSIDEæTHEæ53æINCLUDINGææANDææATæ$ECEMBERæææANDææRESPECTIVELYæATæFAIRæVALUE 465,291
4OTALæDEPOSITS $ 865,936
&EDERALæFUNDSæPURCHASEDæANDæSECURITIESæLOANEDæORæSOLDæUNDERæAGREEMENTSæTOæREPURCHASEæINCLUDINGæææ
ANDææASæOFæ$ECEMBERæææANDææRESPECTIVELYæATæFAIRæVALUE 198,373
"ROKERAGEæPAYABLES 56,696
4RADINGæACCOUNTæLIABILITIES 126,082
3HORTTERMæBORROWINGSæINCLUDINGææANDææATæ$ECEMBERæææANDææRESPECTIVELYæATæFAIRæVALUE 54,441
,ONGTERMæDEBTæINCLUDINGææANDææATæ$ECEMBERæææANDæææRESPECTIVELYæATæFAIRæVALUE 323,505
/THERæLIABILITIESæINCLUDINGææANDææASæOFæ$ECEMBERæææANDææRESPECTIVELYæATæFAIRæVALUE 69,272
Total liabilities $1,694,305
Stockholders’ equity
0REFERREDæSTOCKææPARæVALUEæAUTHORIZEDæSHARESææMILLIONæISSUEDæSHARESæ12,038 at December 31, 2011æANDæ$ECEMBERæææATæ
AGGREGATEæLIQUIDATIONæVALUE $ 312
#OMMONæSTOCKææPARæVALUEæAUTHORIZEDæSHARESææBILLIONæISSUEDæSHARESæ2,937,755,921 at December 31, 2011æ
ANDææATæ$ECEMBERææ 29
!DDITIONALæPAIDINæCAPITAL 105,804
2ETAINEDæEARNINGS 90,520
4REASURYæSTOCKæATæCOSTæ2011—13,877,688 sharesæANDææSHARES (1,071)
!CCUMULATEDæOTHERæCOMPREHENSIVEæINCOMEæLOSS (17,788)
Total Citigroup stockholders’ equity $ 177,806
.ONCONTROLLINGæINTEREST 1,767
Total equity $ 179,573
Total liabilities and equity $1,873,878
The following table presents certain liabilities of consolidated VIEs, which are included in the Consolidated Balance Sheet above. The liabilities in the table
below include third-party liabilities of consolidated VIEs only, and exclude intercompany balances that eliminate in consolidation. The liabilities also exclude
amounts where creditors or beneficial interest holders have recourse to the general credit of Citigroup.
December 31,
In millions of dollars 2011
Liabilities of consolidated VIEs for which creditors or beneficial interest holders do not have recourse to the
general credit of Citigroup
3HORTTERMæBORROWINGSæ $ 21,009
,ONGTERMæDEBTæINCLUDINGææANDææASæOFæ$ECEMBERæææANDæ$ECEMBERæææRESPECTIVELYæFAIRæVALUE 50,451
/THERæLIABILITIES 587
Total liabilities of consolidated VIEs for which creditors or beneficial interest holders do not
have recourse to the general credit of Citigroup $ 72,047
3EEæ.OTESæTOæTHEæ#ONSOLIDATEDæ&INANCIALæ3TATEMENTS