Citibank 2011 Annual Report Download - page 53
Download and view the complete annual report
Please find page 53 of the 2011 Citibank annual report below. You can navigate through the pages in the report by either clicking on the pages listed below, or by using the keyword search tool below to find specific information within the annual report.-
 1
1 -
2
-
3
-
4
-
5
-
6
-
7
-
8
-
9
-
10
-
11
-
12
-
13
-
14
-
15
-
16
-
17
-
18
-
19
-
20
-
21
-
22
-
23
-
24
-
25
-
26
-
27
-
28
-
29
-
30
-
31
-
32
-
33
-
34
-
35
-
36
-
37
-
38
-
39
-
40
-
41
-
42
-
 43
43 -
 44
44 -
 45
45 -
 46
46 -
 47
47 -
 48
48 -
 49
49 -
 50
50 -
 51
51 -
 52
52 -
 53
53 -
 54
54 -
 55
55 -
 56
56 -
 57
57 -
 58
58 -
 59
59 -
 60
60 -
 61
61 -
 62
62 -
 63
63 -
64
-
65
-
66
-
67
-
68
-
69
-
70
-
71
-
72
-
73
-
74
-
75
-
76
-
77
-
78
-
79
-
80
-
81
-
82
-
83
-
84
-
85
-
86
-
87
-
88
-
89
-
90
-
91
-
92
-
93
-
94
-
95
-
96
-
97
-
98
-
99
-
100
-
101
-
102
-
103
-
104
-
105
-
106
-
107
-
108
-
109
-
110
-
111
-
112
-
113
-
114
-
115
-
116
-
117
-
118
-
119
-
120
-
121
-
122
-
123
-
124
-
125
-
126
-
127
-
128
-
129
-
130
-
131
-
132
-
133
-
134
-
135
-
136
-
137
-
138
-
139
-
140
-
141
-
142
-
143
-
144
-
145
-
146
-
147
-
148
-
149
-
150
-
151
-
152
-
153
-
154
-
155
-
156
-
157
-
158
-
159
-
160
-
161
-
162
-
163
-
164
-
165
-
166
-
167
-
168
-
169
-
170
-
171
-
172
-
173
-
174
-
175
-
176
-
177
-
178
-
179
-
180
-
181
-
182
-
183
-
184
-
185
-
186
-
187
-
188
-
189
-
190
-
191
-
192
-
193
-
194
-
195
-
196
-
197
-
198
-
199
-
200
-
201
-
202
-
203
-
204
-
205
-
206
-
207
-
208
-
209
-
210
-
211
-
212
-
213
-
214
-
215
-
216
-
217
-
218
-
219
-
220
-
221
-
222
-
223
-
224
-
225
-
226
-
227
-
228
-
229
-
230
-
231
-
232
-
233
-
234
-
235
-
236
-
237
-
238
-
239
-
240
-
241
-
242
-
243
-
244
-
245
-
246
-
247
-
248
-
249
-
250
-
251
-
252
-
253
-
254
-
255
-
256
-
257
-
258
-
259
-
260
-
261
-
262
-
263
-
264
-
265
-
266
-
267
-
268
-
269
-
270
-
271
-
272
-
273
-
274
-
275
-
276
-
277
-
278
-
279
-
280
-
281
-
282
-
283
-
284
-
285
-
286
-
287
-
288
-
289
-
290
-
291
-
292
-
293
-
294
-
295
-
296
-
297
-
298
-
299
-
300
-
301
-
302
-
303
-
304
-
305
-
306
-
307
-
308
-
309
-
310
-
311
-
312
-
313
-
314
-
315
-
316
-
317
-
318
-
319
-
320
 |
 |

31
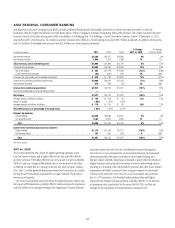
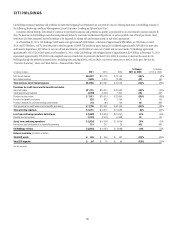
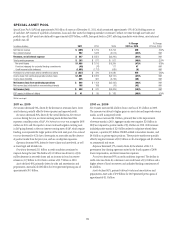
BROKERAGE AND ASSET MANAGEMENT
Brokerage and Asset Management (BAM) consists of Citi’s global retail brokerage and asset management businesses. At December 31, 2011, BAM had
approximately $27 billion of assets, or approximately 10% of Citi Holdings’ assets, primarily consisting of Citi’s investment in, and assets related to, the Morgan
Stanley Smith Barney joint venture (MSSB JV). As more fully described in Forms 8-K filed with the SEC on January 14, 2009 and June 3, 2009, Morgan Stanley
has options to purchase Citi’s remaining stake in the MSSB JV over three years beginning in 2012.
In millions of dollars 2011
% Change
2011 vs. 2010
æ#HANGEæ
æVSæ
.ETæINTERESTæREVENUE $(180) 35% .-
.ONINTERESTæREVENUE 462 (48)
Total revenues, net of interest expense $ 282 (54)%
4OTALæOPERATINGæEXPENSES $ 729 (26)%
.ETæCREDITæLOSSES $4 (76)% .-
#REDITæRESERVEæBUILDæRELEASE (3) 83 .-
0ROVISIONæFORæUNFUNDEDæLENDINGæCOMMITMENTS (1) 83
0ROVISIONæRELEASEæFORæBENEFITSæANDæCLAIMS 48 26
0ROVISIONSæFORæCREDITæLOSSESæANDæFORæBENEFITSæANDæCLAIMS $48 55%
)NCOMEæLOSSæFROMæCONTINUINGæOPERATIONSæBEFOREæTAXES $(495) (21)% .-
)NCOMEæTAXESæBENEFITS (209) (14) .-
Income (loss) from continuing operations $(286) (27)% .-
.ETæINCOMEæATTRIBUTABLEæTOæNONCONTROLLINGæINTERESTS 9 (18)
Net income (loss) $(295) (24)% .-
%/0æASSETSæ(in billions of dollars) $27 —
%/0æDEPOSITSæ(in billions of dollars) 55 (5)%
.-æ .OTæMEANINGFUL
2011 vs. 2010
Net loss increased 24% as lower revenues were only partly offset by
lower expenses.
Revenues decreased by 54%, driven by the 2010 sale of the Habitat and
Colfondos businesses (including a $78 million pretax gain on sale related
to the transactions in the first quarter of 2010) and lower revenues from the
MSSB JV.
Expenses decreased 26%, also driven by divestitures, as well as lower legal
and related expenses.
Provisions increased 55% due to the absence of the prior-year
reserve releases.
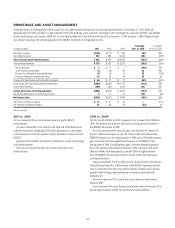
2010 vs. 2009
Net loss was $0.2 billion in 2010, compared to Net income of $6.9 billion in
2009. The decrease was driven by the absence of the gain on sale related to
the MSSB JV transaction in 2009.
Revenues decreased 96% versus the prior year driven by the absence of
the $11.1 billion pretax gain on sale ($6.7 billion after tax) related to the
MSSB JV transaction in the second quarter of 2009 and a $320 million pretax
gain on the sale of the managed futures business to the MSSB JV in the
third quarter of 2009. Excluding these gains, revenues decreased primarily
due to the absence of Smith Barney from May 2009 onwards as well as the
absence of Nikko Asset Management, partially offset by higher revenues
from the MSSB JV and an improvement in marks in the retail alternative
investments business.
Expenses decreased 70% from the prior year, mainly driven by the absence
of Smith Barney from May 2009 onwards, lower MSSB JV separation-related
costs as compared to the prior year and the absence of Nikko and Colfondos,
partially offset by higher legal settlements and reserves associated with
Smith Barney.
Provisions decreased 57%, mainly due to the absence of credit reserve
builds in 2009.
Assets decreased 10% versus the prior year, mostly driven by the sales of the
private equity business and the run-off of tailored loan portfolios.