Citibank 2011 Annual Report Download - page 69
Download and view the complete annual report
Please find page 69 of the 2011 Citibank annual report below. You can navigate through the pages in the report by either clicking on the pages listed below, or by using the keyword search tool below to find specific information within the annual report.-
 1
1 -
2
-
3
-
4
-
5
-
6
-
7
-
8
-
9
-
10
-
11
-
12
-
13
-
14
-
15
-
16
-
17
-
18
-
19
-
20
-
21
-
22
-
23
-
24
-
25
-
26
-
27
-
28
-
29
-
30
-
31
-
32
-
33
-
34
-
35
-
36
-
37
-
38
-
39
-
40
-
41
-
42
-
43
-
44
-
45
-
46
-
47
-
48
-
49
-
50
-
51
-
52
-
53
-
54
-
55
-
56
-
57
-
58
-
 59
59 -
 60
60 -
 61
61 -
 62
62 -
 63
63 -
 64
64 -
 65
65 -
 66
66 -
 67
67 -
 68
68 -
 69
69 -
 70
70 -
 71
71 -
 72
72 -
 73
73 -
 74
74 -
 75
75 -
 76
76 -
 77
77 -
 78
78 -
 79
79 -
80
-
81
-
82
-
83
-
84
-
85
-
86
-
87
-
88
-
89
-
90
-
91
-
92
-
93
-
94
-
95
-
96
-
97
-
98
-
99
-
100
-
101
-
102
-
103
-
104
-
105
-
106
-
107
-
108
-
109
-
110
-
111
-
112
-
113
-
114
-
115
-
116
-
117
-
118
-
119
-
120
-
121
-
122
-
123
-
124
-
125
-
126
-
127
-
128
-
129
-
130
-
131
-
132
-
133
-
134
-
135
-
136
-
137
-
138
-
139
-
140
-
141
-
142
-
143
-
144
-
145
-
146
-
147
-
148
-
149
-
150
-
151
-
152
-
153
-
154
-
155
-
156
-
157
-
158
-
159
-
160
-
161
-
162
-
163
-
164
-
165
-
166
-
167
-
168
-
169
-
170
-
171
-
172
-
173
-
174
-
175
-
176
-
177
-
178
-
179
-
180
-
181
-
182
-
183
-
184
-
185
-
186
-
187
-
188
-
189
-
190
-
191
-
192
-
193
-
194
-
195
-
196
-
197
-
198
-
199
-
200
-
201
-
202
-
203
-
204
-
205
-
206
-
207
-
208
-
209
-
210
-
211
-
212
-
213
-
214
-
215
-
216
-
217
-
218
-
219
-
220
-
221
-
222
-
223
-
224
-
225
-
226
-
227
-
228
-
229
-
230
-
231
-
232
-
233
-
234
-
235
-
236
-
237
-
238
-
239
-
240
-
241
-
242
-
243
-
244
-
245
-
246
-
247
-
248
-
249
-
250
-
251
-
252
-
253
-
254
-
255
-
256
-
257
-
258
-
259
-
260
-
261
-
262
-
263
-
264
-
265
-
266
-
267
-
268
-
269
-
270
-
271
-
272
-
273
-
274
-
275
-
276
-
277
-
278
-
279
-
280
-
281
-
282
-
283
-
284
-
285
-
286
-
287
-
288
-
289
-
290
-
291
-
292
-
293
-
294
-
295
-
296
-
297
-
298
-
299
-
300
-
301
-
302
-
303
-
304
-
305
-
306
-
307
-
308
-
309
-
310
-
311
-
312
-
313
-
314
-
315
-
316
-
317
-
318
-
319
-
320
 |
 |

47
FUNDING AND LIQUIDITY
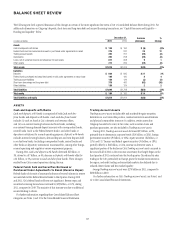
Overview
Citi’s funding and liquidity objectives generally are to maintain liquidity
to fund its existing asset base as well as grow its core businesses in Citicorp,
while at the same time maintain sufficient excess liquidity, structured
appropriately, so that it can operate under a wide variety of market
conditions, including market disruptions for both short- and long-term
periods. Citigroup’s primary liquidity objectives are established by entity, and
in aggregate, across three major categories:
(i) the non-bank, which is largely composed of the parent holding
company (Citigroup) and Citi’s broker-dealer subsidiaries (collectively
referred to in this section as “non-bank”);
(ii) Citi’s significant bank entities, such as Citibank, N.A.; and
(iii) other entities.
At an aggregate level, Citigroup’s goal is to ensure that there is sufficient
funding in amount and tenor to ensure that aggregate liquidity resources are
available for these entities. The liquidity framework requires that entities be
self-sufficient or net providers of liquidity, including in conditions established
under their designated stress tests, and have excess cash capital.
Citi’s primary sources of funding include (i) deposits via Citi’s bank
subsidiaries, which continue to be Citi’s most stable and lowest cost source of
long-term funding, (ii) long-term debt (including long-term collateralized
financings) issued at the non-bank level and certain bank subsidiaries,
and (iii) stockholders’ equity. These sources are supplemented by short-
term borrowings, primarily in the form of secured financing transactions
(securities loaned or sold under agreements to repurchase, or repos), and
commercial paper at the non-bank level.
As referenced above, Citigroup works to ensure that the structural tenor
of these funding sources is sufficiently long in relation to the tenor of its
asset base. The key goal of Citi’s asset-liability management is to ensure that
there is excess tenor in the liability structure so as to provide excess liquidity
to fund the assets. The excess liquidity resulting from a longer-term tenor
profile can effectively offset potential decreases in liquidity that may occur
under stress. This excess funding is held in the form of aggregate liquidity
resources, as described below.
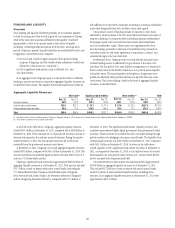
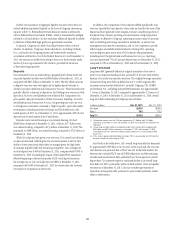
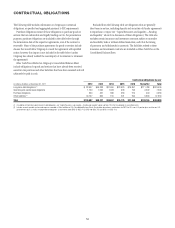
Aggregate Liquidity Resources
Non-bank (1) Significant bank entities Other entities (2) Total
In billions of dollars
Dec. 31,
2011
$ECæææ
Dec. 31,
2011
$ECæææ
Dec. 31,
2011
$ECææ
Dec. 31,
2011
$ECæææ
#ASHæATæMAJORæCENTRALæBANKS $29.1 $ 70.7 $ 27.6 $127.4
5NENCUMBEREDæLIQUIDæSECURITIES 69.3 129.5 79.3 278.1
Total $98.4 $200.2 $106.9 $405.5
æ .ONBANKæINCLUDESæTHEæPARENTæHOLDINGæCOMPANYæ#ITIGROUPæ#ITIGROUPæ&UNDINGæ)NCæ#&)æANDæONEæOFæ#ITISæBROKERDEALERæENTITIESæ#ITIGROUPæ'LOBALæ-ARKETSæ(OLDINGSæ)NCæ#'-()
æ /THERæENTITIESæINCLUDEæ"ANAMEXæANDæOTHERæBANKæENTITIES
As set forth in the table above, Citigroup’s aggregate liquidity resources
totaled $405.5 billion at December 31, 2011, compared with $426.8 billion at
December 31, 2010. These amounts are as of period-end and may increase or
decrease intra-period in the ordinary course of business. During the quarter
ended December 31, 2011, the intra-quarter amounts did not fluctuate
materially from the quarter-end amounts noted above.
At December 31, 2011, Citigroup’s non-bank aggregate liquidity resources
totaled $98.4 billion, compared with $94.5 billion at December 31, 2010. This
amount included unencumbered liquid securities and cash held in Citi’s U.S.
and non-U.S. broker-dealer entities.
Citigroup’s significant bank entities had approximately $200.2 billion of
aggregate liquidity resources as of December 31, 2011. This amount included
$70.7 billion of cash on deposit with major central banks (including the
U.S. Federal Reserve Bank, European Central Bank, Bank of England,
Swiss National Bank, Bank of Japan, the Monetary Authority of Singapore
and the Hong Kong Monetary Authority), compared with $77.4 billion at
December 31, 2010. The significant bank entities’ liquidity resources also
included unencumbered highly liquid government and government-backed
securities. These securities are available-for-sale or secured funding through
private markets or by pledging to the major central banks. The liquidity value
of these liquid securities was $129.5 billion at December 31, 2011, compared
with $145.3 billion at December 31, 2010. As shown in the table above,
overall, liquidity at Citi’s significant bank entities was down at December 31,
2011, as compared to December 31, 2010, as Citi deployed some of its excess
bank liquidity into loan growth within Citicorp (see “Balance Sheet Review”
above) and paid down long-term bank debt.
Citi estimates that its other entities and subsidiaries held approximately
$106.9 billion in aggregate liquidity resources as of December 31, 2011.
This included $27.6 billion of cash on deposit with major central banks
and $79.3 billion of unencumbered liquid securities. Including these
amounts, Citi’s aggregate liquidity resources as of December 31, 2011 were
approximately $405.5 billion.