Citibank 2011 Annual Report Download - page 44
Download and view the complete annual report
Please find page 44 of the 2011 Citibank annual report below. You can navigate through the pages in the report by either clicking on the pages listed below, or by using the keyword search tool below to find specific information within the annual report.-
 1
1 -
2
-
3
-
4
-
5
-
6
-
7
-
8
-
9
-
10
-
11
-
12
-
13
-
14
-
15
-
16
-
17
-
18
-
19
-
20
-
21
-
22
-
23
-
24
-
25
-
26
-
27
-
28
-
29
-
30
-
31
-
32
-
33
-
 34
34 -
 35
35 -
 36
36 -
 37
37 -
 38
38 -
 39
39 -
 40
40 -
 41
41 -
 42
42 -
 43
43 -
 44
44 -
 45
45 -
 46
46 -
 47
47 -
 48
48 -
 49
49 -
 50
50 -
 51
51 -
 52
52 -
 53
53 -
 54
54 -
55
-
56
-
57
-
58
-
59
-
60
-
61
-
62
-
63
-
64
-
65
-
66
-
67
-
68
-
69
-
70
-
71
-
72
-
73
-
74
-
75
-
76
-
77
-
78
-
79
-
80
-
81
-
82
-
83
-
84
-
85
-
86
-
87
-
88
-
89
-
90
-
91
-
92
-
93
-
94
-
95
-
96
-
97
-
98
-
99
-
100
-
101
-
102
-
103
-
104
-
105
-
106
-
107
-
108
-
109
-
110
-
111
-
112
-
113
-
114
-
115
-
116
-
117
-
118
-
119
-
120
-
121
-
122
-
123
-
124
-
125
-
126
-
127
-
128
-
129
-
130
-
131
-
132
-
133
-
134
-
135
-
136
-
137
-
138
-
139
-
140
-
141
-
142
-
143
-
144
-
145
-
146
-
147
-
148
-
149
-
150
-
151
-
152
-
153
-
154
-
155
-
156
-
157
-
158
-
159
-
160
-
161
-
162
-
163
-
164
-
165
-
166
-
167
-
168
-
169
-
170
-
171
-
172
-
173
-
174
-
175
-
176
-
177
-
178
-
179
-
180
-
181
-
182
-
183
-
184
-
185
-
186
-
187
-
188
-
189
-
190
-
191
-
192
-
193
-
194
-
195
-
196
-
197
-
198
-
199
-
200
-
201
-
202
-
203
-
204
-
205
-
206
-
207
-
208
-
209
-
210
-
211
-
212
-
213
-
214
-
215
-
216
-
217
-
218
-
219
-
220
-
221
-
222
-
223
-
224
-
225
-
226
-
227
-
228
-
229
-
230
-
231
-
232
-
233
-
234
-
235
-
236
-
237
-
238
-
239
-
240
-
241
-
242
-
243
-
244
-
245
-
246
-
247
-
248
-
249
-
250
-
251
-
252
-
253
-
254
-
255
-
256
-
257
-
258
-
259
-
260
-
261
-
262
-
263
-
264
-
265
-
266
-
267
-
268
-
269
-
270
-
271
-
272
-
273
-
274
-
275
-
276
-
277
-
278
-
279
-
280
-
281
-
282
-
283
-
284
-
285
-
286
-
287
-
288
-
289
-
290
-
291
-
292
-
293
-
294
-
295
-
296
-
297
-
298
-
299
-
300
-
301
-
302
-
303
-
304
-
305
-
306
-
307
-
308
-
309
-
310
-
311
-
312
-
313
-
314
-
315
-
316
-
317
-
318
-
319
-
320
 |
 |

22
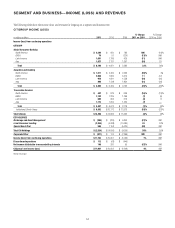
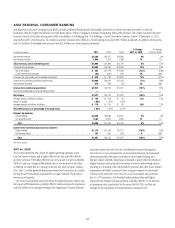
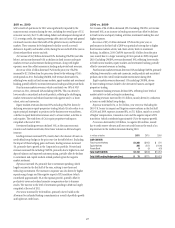
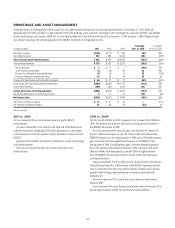
ASIA REGIONAL CONSUMER BANKING
Asia Regional Consumer Banking (Asia RCB) provides traditional banking and Citi-branded card services to retail customers and small- to mid-size
businesses, with the largest Citi presence in South Korea, Japan, Taiwan, Singapore, Australia, Hong Kong, India and Indonesia. Citi’s Japan Consumer Finance
business, which Citi has been exiting since 2008, is included in Citi Holdings (see “Citi Holdings—Local Consumer Lending” below). At December 31, 2011,
Asia RCB had 671 retail branches, 16.3 million customer accounts, $66.2 billion in retail banking loans and $109.7 billion in deposits. In addition, the business
had 15.9 million Citi-branded card accounts with $21.0 billion in outstanding loan balances.
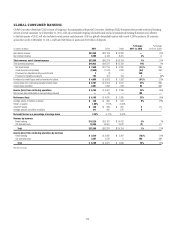
In millions of dollars 2011
% Change
2011 vs. 2010
æ#HANGEæ
æVSæ
.ETæINTERESTæREVENUE $ 5,365 6%
.ONINTERESTæREVENUE 2,644 14
Total revenues, net of interest expense $ 8,009 8%
4OTALæOPERATINGæEXPENSES $ 4,583 13%
.ETæCREDITæLOSSES $ 883 (13)%
#REDITæRESERVEæBUILDæRELEASE (63) 78 .-
0ROVISIONSæFORæLOANæLOSSESæANDæFORæBENEFITSæANDæCLAIMS $ 820 13%
)NCOMEæFROMæCONTINUINGæOPERATIONSæBEFOREæTAXES $ 2,606 (1)%
)NCOMEæTAXESæBENEFITS 679 38 .-
Income from continuing operations $ 1,927 (10)%
.ETæINCOMEæATTRIBUTABLEæTOæNONCONTROLLINGæINTERESTS — —
Net income $ 1,927 (10)%
!VERAGEæASSETS (in billions of dollars) $ 122 13%
2ETURNæONæASSETS 1.58%
!VERAGEæDEPOSITSæ(in billions of dollars) $ 110 10%
Net credit losses as a percentage of average loans 1.03%
Revenue by business
2ETAILæBANKING $ 4,825 5%
#ITIBRANDEDæCARDS 3,184 13
Total $ 8,009 8%
Income from continuing operations by business
2ETAILæBANKING $ 1,174 (18)%
#ITIBRANDEDæCARDS 753 8.-
Total $ 1,927 (10)%
.-æ .OTæMEANINGFUL
2011 vs. 2010
Net income decreased 10%, driven by higher operating expenses, lower
loan loss reserve releases and a higher effective tax rate, partially offset by
growth in revenue. The higher effective tax rate was due to lower tax benefits
(APB 23) and a tax charge of $66 million due to a write-down in the value
of deferred tax assets due to a change in the tax law, each in Japan. During
2011, the U.S. dollar generally depreciated versus local currencies. As a result,
the impact of FX translation accounted for an approximately 5% growth in
revenues and expenses.
Revenues increased 8%, primarily driven by higher business volumes and
the impact of FX translation, partially offset by continued spread compression
and $65 million of net charges relating to the repurchase of certain Lehman
structured notes (see Note 29 to the Consolidated Financial Statements).
Net interest revenue increased 6%, as investment initiatives and sustained
economic growth in the region continued to drive higher lending and
deposit volumes. Spread compression continued to partly offset the benefit of
higher balances and continued to be driven by stricter underwriting criteria
resulting in a lowering of the risk profile for personal and other loans. Spread
compression will likely continue to have a negative impact on net interest
revenue in the near-term. Non-interest revenue increased 14%, primarily
due to a 17% increase in Citi-branded cards purchase sales and higher
revenues from foreign exchange products, partially offset by a 12% decrease
in investment sales, particularly in the second half of 2011, and the net
charges for the repurchase of certain Lehman structured notes.