Citibank 2011 Annual Report Download - page 210
Download and view the complete annual report
Please find page 210 of the 2011 Citibank annual report below. You can navigate through the pages in the report by either clicking on the pages listed below, or by using the keyword search tool below to find specific information within the annual report.-
 1
1 -
2
-
3
-
4
-
5
-
6
-
7
-
8
-
9
-
10
-
11
-
12
-
13
-
14
-
15
-
16
-
17
-
18
-
19
-
20
-
21
-
22
-
23
-
24
-
25
-
26
-
27
-
28
-
29
-
30
-
31
-
32
-
33
-
34
-
35
-
36
-
37
-
38
-
39
-
40
-
41
-
42
-
43
-
44
-
45
-
46
-
47
-
48
-
49
-
50
-
51
-
52
-
53
-
54
-
55
-
56
-
57
-
58
-
59
-
60
-
61
-
62
-
63
-
64
-
65
-
66
-
67
-
68
-
69
-
70
-
71
-
72
-
73
-
74
-
75
-
76
-
77
-
78
-
79
-
80
-
81
-
82
-
83
-
84
-
85
-
86
-
87
-
88
-
89
-
90
-
91
-
92
-
93
-
94
-
95
-
96
-
97
-
98
-
99
-
100
-
101
-
102
-
103
-
104
-
105
-
106
-
107
-
108
-
109
-
110
-
111
-
112
-
113
-
114
-
115
-
116
-
117
-
118
-
119
-
120
-
121
-
122
-
123
-
124
-
125
-
126
-
127
-
128
-
129
-
130
-
131
-
132
-
133
-
134
-
135
-
136
-
137
-
138
-
139
-
140
-
141
-
142
-
143
-
144
-
145
-
146
-
147
-
148
-
149
-
150
-
151
-
152
-
153
-
154
-
155
-
156
-
157
-
158
-
159
-
160
-
161
-
162
-
163
-
164
-
165
-
166
-
167
-
168
-
169
-
170
-
171
-
172
-
173
-
174
-
175
-
176
-
177
-
178
-
179
-
180
-
181
-
182
-
183
-
184
-
185
-
186
-
187
-
188
-
189
-
190
-
191
-
192
-
193
-
194
-
195
-
196
-
197
-
198
-
199
-
 200
200 -
 201
201 -
 202
202 -
 203
203 -
 204
204 -
 205
205 -
 206
206 -
 207
207 -
 208
208 -
 209
209 -
 210
210 -
 211
211 -
 212
212 -
 213
213 -
 214
214 -
 215
215 -
 216
216 -
 217
217 -
 218
218 -
 219
219 -
 220
220 -
221
-
222
-
223
-
224
-
225
-
226
-
227
-
228
-
229
-
230
-
231
-
232
-
233
-
234
-
235
-
236
-
237
-
238
-
239
-
240
-
241
-
242
-
243
-
244
-
245
-
246
-
247
-
248
-
249
-
250
-
251
-
252
-
253
-
254
-
255
-
256
-
257
-
258
-
259
-
260
-
261
-
262
-
263
-
264
-
265
-
266
-
267
-
268
-
269
-
270
-
271
-
272
-
273
-
274
-
275
-
276
-
277
-
278
-
279
-
280
-
281
-
282
-
283
-
284
-
285
-
286
-
287
-
288
-
289
-
290
-
291
-
292
-
293
-
294
-
295
-
296
-
297
-
298
-
299
-
300
-
301
-
302
-
303
-
304
-
305
-
306
-
307
-
308
-
309
-
310
-
311
-
312
-
313
-
314
-
315
-
316
-
317
-
318
-
319
-
320
 |
 |

188
During the first quarter of 2011, the Company determined that it no
longer had the intent to hold $12.7 billion of HTM securities to maturity.
As a result, the Company reclassified $10.0 billion carrying value of
mortgage-backed, other asset-backed, state and municipal, and corporate
debt securities from Investments held-to-maturity to Trading account
assets. The Company also sold an additional $2.7 billion of such HTM
securities, recognizing a corresponding receivable from the unsettled
sales as of March 31, 2011. As a result of these actions, a net pretax loss of
$709 million ($427 million after tax) was recognized in the Consolidated
Statement of Income for the three months ended March 31, 2011, composed
of gross unrealized gains of $311 million included in Other revenue, gross
unrealized losses of $1,387 million included in Other-than-temporary-
impairment losses on investments, and net realized gains of $367 million
included in Realized gains (losses) on sales of investments. Prior to the
reclassification, unrealized losses totalling $1,656 million pretax ($1,012
million after tax) had been reflected in AOCI (see table below) and have now
been reflected in the Consolidated Statement of Income, as detailed above.
Citigroup reclassified and sold the securities as part of its overall efforts to
mitigate its risk-weighted assets (RWA) in order to comply with significant
new regulatory capital requirements which, although not yet implemented
or formally adopted, are nonetheless currently being used to assess the
forecasted capital adequacy of the Company and other large U.S. banking
organizations. These regulatory capital changes, which were largely
unforeseen when the Company initially reclassified the debt securities from
Trading account assets and Investments available-for-sale to Investments
held-to-maturity in the fourth quarter of 2008 (see note 1 to the table below),
include: (i) the U.S. Basel II credit and operational risk capital standards;
(ii) the Basel Committee’s agreed-upon, and the U.S.-proposed, revisions
to the market risk capital rules, which significantly increased the risk
weightings for certain trading book positions; (iii) the Basel Committee’s
substantial issuance of Basel III, which raised the quantity and quality of
required regulatory capital and materially increased RWA for securitization
exposures; and (iv) certain regulatory capital-related provisions in The
Dodd-Frank Wall Street Reform and Consumer Protection Act of 2010.
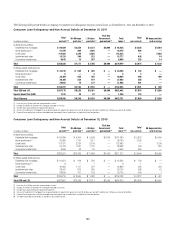
Through December 31, 2011, the Company has sold substantially all of the $12.7 billion of HTM securities that were reclassified to Trading account assets
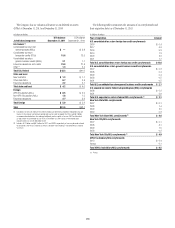
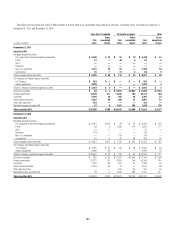
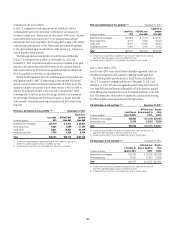
in the first quarter of 2011. The carrying value and fair value of debt securities at the date of reclassification or sale were as follows:
In millions of dollars
Amortized
cost (2)
Net unrealized
loss
recognized in
AOCI
Carrying
value (3)
Gross
gains
Gross
losses
Fair
value
Held-to-maturity debt securities transferred
to Trading account assets or sold (1)
-ORTGAGEBACKEDæSECURITIES
0RIME $ 3,410 $ 528 $ 2,882 $ 131 $ 131 $ 2,882
!LT! 5,357 896 4,461 605 188 4,878
3UBPRIME 240 7 233 5 36 202
.ON53æRESIDENTIAL 317 75 242 76 2 316
#OMMERCIAL 117 18 99 22 — 121
4OTALæMORTGAGEBACKEDæSECURITIES $ 9,441 $ 1,524 $ 7,917 $ 839 $ 357 $ 8,399
3TATEæANDæMUNICIPAL $ 900 $ 8 $ 892 $ 68 $ 7 $ 953
#ORPORATE 3,569 115 3,454 396 41 3,809
!SSETBACKEDæSECURITIES 456 9 447 50 2 495
Total held-to-maturity debt securities transferred
to Trading account assets or sold (1) $ 14,366 $ 1,656 $ 12,710 $ 1,353 $ 407 $13,656
æ $URINGæTHEæFOURTHæQUARTERæOFæææBILLIONæANDææBILLIONæCARRYINGæVALUEæOFæTHESEæDEBTæSECURITIESæWEREæTRANSFERREDæFROMæTrading account assets ANDæInvestmentsæAVAILABLEFORSALEæTOæInvestments HELDTOMATURITYæ
RESPECTIVELYæ4HEæTRANSFERæOFæTHESEæDEBTæSECURITIESæFROMæTrading account assets WASæINæRESPONSEæTOæTHEæSIGNIFICANTæDETERIORATIONæINæMARKETæCONDITIONSæWHICHæWASæESPECIALLYæACUTEæDURINGæTHEæFOURTHæQUARTERæOFæ
æ &ORæSECURITIESæTRANSFERREDæTOæHELDTOMATURITYæFROMæTrading account assets INææAMORTIZEDæCOSTæISæDEFINEDæASæTHEæFAIRæVALUEæAMOUNTæOFæTHEæSECURITIESæATæTHEæDATEæOFæTRANSFERæPLUSæANYæACCRETIONæINCOMEæANDæLESSæANYæ
IMPAIRMENTSæRECOGNIZEDæINæEARNINGSæSUBSEQUENTæTOæTRANSFERæ&ORæSECURITIESæTRANSFERREDæTOæHELDTOMATURITYæFROMæAVAILABLEFORSALEæINææAMORTIZEDæCOSTæISæDEFINEDæASæTHEæORIGINALæPURCHASEæCOSTæPLUSæORæMINUSæANYæ
ACCRETIONæORæAMORTIZATIONæOFæAæPURCHASEæDISCOUNTæORæPREMIUMæLESSæANYæIMPAIRMENTæRECOGNIZEDæINæEARNINGS
æ (ELDTOMATURITYæSECURITIESæAREæCARRIEDæONæTHEæ#ONSOLIDATEDæ"ALANCEæ3HEETæATæAMORTIZEDæCOSTæANDæTHEæCHANGESæINæTHEæVALUEæOFæTHESEæSECURITIESæOTHERæTHANæIMPAIRMENTæCHARGESæAREæNOTæREPORTEDæINæTHEæFINANCIALæSTATEMENTS