Citibank 2011 Annual Report Download - page 37
Download and view the complete annual report
Please find page 37 of the 2011 Citibank annual report below. You can navigate through the pages in the report by either clicking on the pages listed below, or by using the keyword search tool below to find specific information within the annual report.-
 1
1 -
2
-
3
-
4
-
5
-
6
-
7
-
8
-
9
-
10
-
11
-
12
-
13
-
14
-
15
-
16
-
17
-
18
-
19
-
20
-
21
-
22
-
23
-
24
-
25
-
26
-
 27
27 -
 28
28 -
 29
29 -
 30
30 -
 31
31 -
 32
32 -
 33
33 -
 34
34 -
 35
35 -
 36
36 -
 37
37 -
 38
38 -
 39
39 -
 40
40 -
 41
41 -
 42
42 -
 43
43 -
 44
44 -
 45
45 -
 46
46 -
 47
47 -
48
-
49
-
50
-
51
-
52
-
53
-
54
-
55
-
56
-
57
-
58
-
59
-
60
-
61
-
62
-
63
-
64
-
65
-
66
-
67
-
68
-
69
-
70
-
71
-
72
-
73
-
74
-
75
-
76
-
77
-
78
-
79
-
80
-
81
-
82
-
83
-
84
-
85
-
86
-
87
-
88
-
89
-
90
-
91
-
92
-
93
-
94
-
95
-
96
-
97
-
98
-
99
-
100
-
101
-
102
-
103
-
104
-
105
-
106
-
107
-
108
-
109
-
110
-
111
-
112
-
113
-
114
-
115
-
116
-
117
-
118
-
119
-
120
-
121
-
122
-
123
-
124
-
125
-
126
-
127
-
128
-
129
-
130
-
131
-
132
-
133
-
134
-
135
-
136
-
137
-
138
-
139
-
140
-
141
-
142
-
143
-
144
-
145
-
146
-
147
-
148
-
149
-
150
-
151
-
152
-
153
-
154
-
155
-
156
-
157
-
158
-
159
-
160
-
161
-
162
-
163
-
164
-
165
-
166
-
167
-
168
-
169
-
170
-
171
-
172
-
173
-
174
-
175
-
176
-
177
-
178
-
179
-
180
-
181
-
182
-
183
-
184
-
185
-
186
-
187
-
188
-
189
-
190
-
191
-
192
-
193
-
194
-
195
-
196
-
197
-
198
-
199
-
200
-
201
-
202
-
203
-
204
-
205
-
206
-
207
-
208
-
209
-
210
-
211
-
212
-
213
-
214
-
215
-
216
-
217
-
218
-
219
-
220
-
221
-
222
-
223
-
224
-
225
-
226
-
227
-
228
-
229
-
230
-
231
-
232
-
233
-
234
-
235
-
236
-
237
-
238
-
239
-
240
-
241
-
242
-
243
-
244
-
245
-
246
-
247
-
248
-
249
-
250
-
251
-
252
-
253
-
254
-
255
-
256
-
257
-
258
-
259
-
260
-
261
-
262
-
263
-
264
-
265
-
266
-
267
-
268
-
269
-
270
-
271
-
272
-
273
-
274
-
275
-
276
-
277
-
278
-
279
-
280
-
281
-
282
-
283
-
284
-
285
-
286
-
287
-
288
-
289
-
290
-
291
-
292
-
293
-
294
-
295
-
296
-
297
-
298
-
299
-
300
-
301
-
302
-
303
-
304
-
305
-
306
-
307
-
308
-
309
-
310
-
311
-
312
-
313
-
314
-
315
-
316
-
317
-
318
-
319
-
320
 |
 |

15
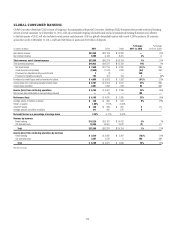
GLOBAL CONSUMER BANKING
Global Consumer Banking (GCB) consists of Citigroup’s four geographical Regional Consumer Banking (RCB) businesses that provide traditional banking
services to retail customers. As of December 31, 2011, GCB also contained Citigroup’s branded cards and local commercial banking businesses and, effective
in the first quarter of 2012, will also include its retail partner cards business. GCB is a globally diversified business with nearly 4,200 branches in 39 countries
around the world. At December 31, 2011, GCB had $340 billion of assets and $313 billion of deposits.
In millions of dollars 2011
% Change
2011 vs. 2010
æ#HANGEææ
æVSæ
.ETæINTERESTæREVENUE $23,090 —
.ONINTERESTæREVENUE 9,495 3%
Total revenues, net of interest expense $32,585 1%
4OTALæOPERATINGæEXPENSES $18,933 14%
.ETæCREDITæLOSSES $ 7,688 (31)% .-
#REDITæRESERVEæBUILDæRELEASE (2,988) (94) .-
0ROVISIONSæFORæUNFUNDEDæLENDINGæCOMMITMENTS 3 NM
0ROVISIONæFORæBENEFITSæANDæCLAIMS 152 1
0ROVISIONSæFORæCREDITæLOSSESæANDæFORæBENEFITSæANDæCLAIMS $ 4,855 (51)%
)NCOMEæLOSSæFROMæCONTINUINGæOPERATIONSæBEFOREæTAXES $ 8,797 47% .-
)NCOMEæTAXESæBENEFITS 2,601 94 .-
Income (loss) from continuing operations $ 6,196 33%
.ETæINCOMEæLOSSæATTRIBUTABLEæTOæNONCONTROLLINGæINTERESTS — 100
Net income (loss) $ 6,196 33%
!VERAGEæASSETSæ(in billions of dollars) $ 335 8%
2ETURNæONæASSETS 1.85%
4OTALæ%/0æASSETS $ 340 4
!VERAGEæDEPOSITSæ(in billions of dollars) 311 5
Net credit losses as a percentage of average loans 3.25%
Revenue by business
2ETAILæBANKING $16,229 3%
#ITIBRANDEDæCARDS 16,356 (2)
Total $32,585 1%
Income (loss) from continuing operations by business
2ETAILæBANKING $ 2,529 (18)%
#ITIBRANDEDæCARDS 3,667 NM .-
Total $ 6,196 33%
.-æ .OTæMEANINGFUL