Citibank 2011 Annual Report Download - page 262
Download and view the complete annual report
Please find page 262 of the 2011 Citibank annual report below. You can navigate through the pages in the report by either clicking on the pages listed below, or by using the keyword search tool below to find specific information within the annual report.-
 1
1 -
2
-
3
-
4
-
5
-
6
-
7
-
8
-
9
-
10
-
11
-
12
-
13
-
14
-
15
-
16
-
17
-
18
-
19
-
20
-
21
-
22
-
23
-
24
-
25
-
26
-
27
-
28
-
29
-
30
-
31
-
32
-
33
-
34
-
35
-
36
-
37
-
38
-
39
-
40
-
41
-
42
-
43
-
44
-
45
-
46
-
47
-
48
-
49
-
50
-
51
-
52
-
53
-
54
-
55
-
56
-
57
-
58
-
59
-
60
-
61
-
62
-
63
-
64
-
65
-
66
-
67
-
68
-
69
-
70
-
71
-
72
-
73
-
74
-
75
-
76
-
77
-
78
-
79
-
80
-
81
-
82
-
83
-
84
-
85
-
86
-
87
-
88
-
89
-
90
-
91
-
92
-
93
-
94
-
95
-
96
-
97
-
98
-
99
-
100
-
101
-
102
-
103
-
104
-
105
-
106
-
107
-
108
-
109
-
110
-
111
-
112
-
113
-
114
-
115
-
116
-
117
-
118
-
119
-
120
-
121
-
122
-
123
-
124
-
125
-
126
-
127
-
128
-
129
-
130
-
131
-
132
-
133
-
134
-
135
-
136
-
137
-
138
-
139
-
140
-
141
-
142
-
143
-
144
-
145
-
146
-
147
-
148
-
149
-
150
-
151
-
152
-
153
-
154
-
155
-
156
-
157
-
158
-
159
-
160
-
161
-
162
-
163
-
164
-
165
-
166
-
167
-
168
-
169
-
170
-
171
-
172
-
173
-
174
-
175
-
176
-
177
-
178
-
179
-
180
-
181
-
182
-
183
-
184
-
185
-
186
-
187
-
188
-
189
-
190
-
191
-
192
-
193
-
194
-
195
-
196
-
197
-
198
-
199
-
200
-
201
-
202
-
203
-
204
-
205
-
206
-
207
-
208
-
209
-
210
-
211
-
212
-
213
-
214
-
215
-
216
-
217
-
218
-
219
-
220
-
221
-
222
-
223
-
224
-
225
-
226
-
227
-
228
-
229
-
230
-
231
-
232
-
233
-
234
-
235
-
236
-
237
-
238
-
239
-
240
-
241
-
242
-
243
-
244
-
245
-
246
-
247
-
248
-
249
-
250
-
251
-
 252
252 -
 253
253 -
 254
254 -
 255
255 -
 256
256 -
 257
257 -
 258
258 -
 259
259 -
 260
260 -
 261
261 -
 262
262 -
 263
263 -
 264
264 -
 265
265 -
 266
266 -
 267
267 -
 268
268 -
 269
269 -
 270
270 -
 271
271 -
 272
272 -
273
-
274
-
275
-
276
-
277
-
278
-
279
-
280
-
281
-
282
-
283
-
284
-
285
-
286
-
287
-
288
-
289
-
290
-
291
-
292
-
293
-
294
-
295
-
296
-
297
-
298
-
299
-
300
-
301
-
302
-
303
-
304
-
305
-
306
-
307
-
308
-
309
-
310
-
311
-
312
-
313
-
314
-
315
-
316
-
317
-
318
-
319
-
320
 |
 |
240
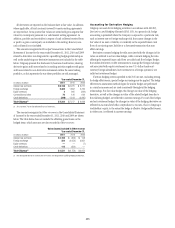
Citigroup evaluates the payment/performance risk of the credit derivatives for
which it stands as a protection seller based on the credit rating assigned to the
underlying referenced credit. Where external ratings by nationally recognized
statistical rating organizations (such as Moody’s and S&P) are used, investment
grade ratings are considered to be Baa/BBB or above, while anything below
is considered non-investment grade. The Citigroup internal ratings are in
line with the related external credit rating system. On certain underlying
reference credits, mainly related to over-the-counter credit derivatives,
ratings are not available, and these are included in the not-rated category.
Credit derivatives written on an underlying non-investment grade reference
credit represent greater payment risk to the Company. The non-investment
grade category in the table above primarily includes credit derivatives where
the underlying referenced entity has been downgraded subsequent to the
inception of the derivative.
The maximum potential amount of future payments under credit
derivative contracts presented in the table above is based on the notional
value of the derivatives. The Company believes that the maximum potential
amount of future payments for credit protection sold is not representative
of the actual loss exposure based on historical experience. This amount
has not been reduced by the Company’s rights to the underlying assets and
the related cash flows. In accordance with most credit derivative contracts,
should a credit event (or settlement trigger) occur, the Company is usually
liable for the difference between the protection sold and the recourse it holds
in the value of the underlying assets. Thus, if the reference entity defaults,
Citi will generally have a right to collect on the underlying reference credit
and any related cash flows, while being liable for the full notional amount
of credit protection sold to the buyer. Furthermore, this maximum potential
amount of future payments for credit protection sold has not been reduced
for any cash collateral paid to a given counterparty as such payments would
be calculated after netting all derivative exposures, including any credit
derivatives with that counterparty in accordance with a related master
netting agreement. Due to such netting processes, determining the amount of
collateral that corresponds to credit derivative exposures alone is not possible.
The Company actively monitors open credit risk exposures, and manages
this exposure by using a variety of strategies including purchased credit
derivatives, cash collateral or direct holdings of the referenced assets. This
risk mitigation activity is not captured in the table above.
Credit-Risk-Related Contingent Features in Derivatives
Certain derivative instruments contain provisions that require the Company
to either post additional collateral or immediately settle any outstanding
liability balances upon the occurrence of a specified credit-risk-related
event. These events, which are defined by the existing derivative contracts,
are primarily downgrades in the credit ratings of the Company and its
affiliates. The fair value (excluding CVA) of all derivative instruments
with credit-risk-related contingent features that are in a liability
position at December 31, 2011 and December 31, 2010 is $26 billion
and $23 billion, respectively. The Company has posted $21 billion and
$18 billion as collateral for this exposure in the normal course of business as
of December 31, 2011 and December 31, 2010, respectively. Each downgrade
would trigger additional collateral requirements for the Company and its
affiliates. In the event that each legal entity was downgraded a single notch
as of December 31, 2011, the Company would be required to post additional
collateral of $3.1 billion.