Citibank 2011 Annual Report Download - page 222
Download and view the complete annual report
Please find page 222 of the 2011 Citibank annual report below. You can navigate through the pages in the report by either clicking on the pages listed below, or by using the keyword search tool below to find specific information within the annual report.-
 1
1 -
2
-
3
-
4
-
5
-
6
-
7
-
8
-
9
-
10
-
11
-
12
-
13
-
14
-
15
-
16
-
17
-
18
-
19
-
20
-
21
-
22
-
23
-
24
-
25
-
26
-
27
-
28
-
29
-
30
-
31
-
32
-
33
-
34
-
35
-
36
-
37
-
38
-
39
-
40
-
41
-
42
-
43
-
44
-
45
-
46
-
47
-
48
-
49
-
50
-
51
-
52
-
53
-
54
-
55
-
56
-
57
-
58
-
59
-
60
-
61
-
62
-
63
-
64
-
65
-
66
-
67
-
68
-
69
-
70
-
71
-
72
-
73
-
74
-
75
-
76
-
77
-
78
-
79
-
80
-
81
-
82
-
83
-
84
-
85
-
86
-
87
-
88
-
89
-
90
-
91
-
92
-
93
-
94
-
95
-
96
-
97
-
98
-
99
-
100
-
101
-
102
-
103
-
104
-
105
-
106
-
107
-
108
-
109
-
110
-
111
-
112
-
113
-
114
-
115
-
116
-
117
-
118
-
119
-
120
-
121
-
122
-
123
-
124
-
125
-
126
-
127
-
128
-
129
-
130
-
131
-
132
-
133
-
134
-
135
-
136
-
137
-
138
-
139
-
140
-
141
-
142
-
143
-
144
-
145
-
146
-
147
-
148
-
149
-
150
-
151
-
152
-
153
-
154
-
155
-
156
-
157
-
158
-
159
-
160
-
161
-
162
-
163
-
164
-
165
-
166
-
167
-
168
-
169
-
170
-
171
-
172
-
173
-
174
-
175
-
176
-
177
-
178
-
179
-
180
-
181
-
182
-
183
-
184
-
185
-
186
-
187
-
188
-
189
-
190
-
191
-
192
-
193
-
194
-
195
-
196
-
197
-
198
-
199
-
200
-
201
-
202
-
203
-
204
-
205
-
206
-
207
-
208
-
209
-
210
-
211
-
 212
212 -
 213
213 -
 214
214 -
 215
215 -
 216
216 -
 217
217 -
 218
218 -
 219
219 -
 220
220 -
 221
221 -
 222
222 -
 223
223 -
 224
224 -
 225
225 -
 226
226 -
 227
227 -
 228
228 -
 229
229 -
 230
230 -
 231
231 -
 232
232 -
233
-
234
-
235
-
236
-
237
-
238
-
239
-
240
-
241
-
242
-
243
-
244
-
245
-
246
-
247
-
248
-
249
-
250
-
251
-
252
-
253
-
254
-
255
-
256
-
257
-
258
-
259
-
260
-
261
-
262
-
263
-
264
-
265
-
266
-
267
-
268
-
269
-
270
-
271
-
272
-
273
-
274
-
275
-
276
-
277
-
278
-
279
-
280
-
281
-
282
-
283
-
284
-
285
-
286
-
287
-
288
-
289
-
290
-
291
-
292
-
293
-
294
-
295
-
296
-
297
-
298
-
299
-
300
-
301
-
302
-
303
-
304
-
305
-
306
-
307
-
308
-
309
-
310
-
311
-
312
-
313
-
314
-
315
-
316
-
317
-
318
-
319
-
320
 |
 |

200
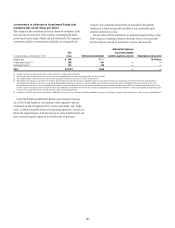
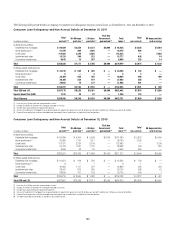
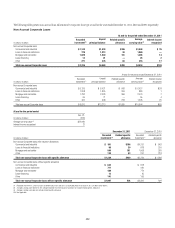
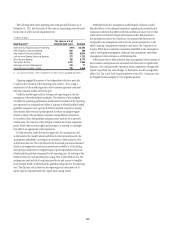
Corporate Loan Delinquency and Non-Accrual Details at December 31, 2011
In millions of dollars
30–89 days
past due
and accruing (1)
≥ 90 days
past due and
accruing (1)
Total past due
and accruing
Total
non-accrual (2)
Total
current (3)
Total
loans
#OMMERCIALæANDæINDUSTRIAL $ 93 $ 30 $123 $1,144 $ 98,577 $ 99,844
&INANCIALæINSTITUTIONS 0 2 2 779 60,762 61,543
-ORTGAGEæANDæREALæESTATE 224 125 349 1,029 26,107 27,485
,EASES 3 11 14 13 1,811 1,838
/THER 225 15 240 271 28,351 28,862
,OANSæATæFAIRæVALUE 3,939
Total $ 545 $183 $728 $3,236 $215,608 $223,511
æ #ORPORATEæLOANSæTHATæAREæGREATERæTHANææDAYSæPASTæDUEæAREæGENERALLYæCLASSIFIEDæASæNONACCRUALæ#ORPORATEæLOANSæAREæCONSIDEREDæPASTæDUEæWHENæPRINCIPALæORæINTERESTæISæCONTRACTUALLYæDUEæBUTæUNPAID
æ #ITIæGENERALLYæDOESæNOTæMANAGEæ#ORPORATEæLOANSæONæAæDELINQUENCYæBASISæ.ONACCRUALæLOANSæGENERALLYæINCLUDEæTHOSEæLOANSæTHATæAREæ≥ææDAYSæPASTæDUEæORæTHOSEæLOANSæFORæWHICHæ#ITIæBELIEVESæBASEDæONæACTUALæEXPERIENCEæ
ANDæAæFORWARDLOOKINGæASSESSMENTæOFæTHEæCOLLECTABILITYæOFæTHEæLOANæINæFULLæTHATæTHEæPAYMENTæOFæINTERESTæORæPRINCIPALæISæDOUBTFUL
æ #ORPORATEæLOANSæAREæPASTæDUEæWHENæPRINCIPALæORæINTERESTæISæCONTRACTUALLYæDUEæBUTæUNPAIDæ,OANSæLESSæTHANææDAYSæPASTæDUEæAREæPRESENTEDæASæCURRENT
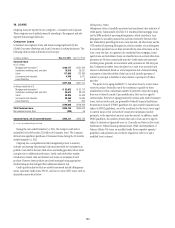
Corporate Loan Delinquency and Non-Accrual Details at December 31, 2010
In millions of dollars
30–89 days
past due
and accruing (1)
≥ 90 days
past due and
accruing (1)
Total past due
and accruing
Total
non-accrual (2)
Total
current (3)
Total
loans
#OMMERCIALæANDæINDUSTRIAL
&INANCIALæINSTITUTIONS
-ORTGAGEæANDæREALæESTATE
,EASES
/THER
,OANSæATæFAIRæVALUE
Total
æ #ORPORATEæLOANSæTHATæAREæGREATERæTHANææDAYSæPASTæDUEæAREæGENERALLYæCLASSIFIEDæASæNONACCRUALæ#ORPORATEæLOANSæAREæCONSIDEREDæPASTæDUEæWHENæPRINCIPALæORæINTERESTæISæCONTRACTUALLYæDUEæBUTæUNPAID
æ #ITIæGENERALLYæDOESæNOTæMANAGEæ#ORPORATEæLOANSæONæAæDELINQUENCYæBASISæ.ONACCRUALæLOANSæGENERALLYæINCLUDEæTHOSEæLOANSæTHATæAREæ≥ææDAYSæPASTæDUEæORæTHOSEæLOANSæFORæWHICHæ#ITIæBELIEVESæBASEDæONæACTUALæEXPERIENCEæ
ANDæAæFORWARDLOOKINGæASSESSMENTæOFæTHEæCOLLECTABILITYæOFæTHEæLOANæINæFULLæTHATæTHEæPAYMENTæOFæINTERESTæORæPRINCIPALæISæDOUBTFUL
æ #ORPORATEæLOANSæAREæPASTæDUEæWHENæPRINCIPALæORæINTERESTæISæCONTRACTUALLYæDUEæBUTæUNPAIDæ,OANSæLESSæTHANææDAYSæPASTæDUEæAREæPRESENTEDæASæCURRENT
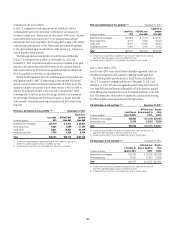
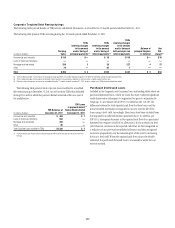
Citigroup has established a risk management process to monitor, evaluate
and manage the principal risks associated with its Corporate loan portfolio.
As part of its risk management process, Citi assigns numeric risk ratings to
its Corporate loan facilities based on quantitative and qualitative assessments
of the obligor and facility. These risk ratings are reviewed at least annually
or more often if material events related to the obligor or facility warrant.
Factors considered in assigning the risk ratings include: financial condition
of the obligor, qualitative assessment of management and strategy, amount
and sources of repayment, amount and type of collateral and guarantee
arrangements, amount and type of any contingencies associated with the
obligor, and the obligor’s industry and geography.
The obligor risk ratings are defined by ranges of default probabilities. The
facility risk ratings are defined by ranges of loss norms, which are the product
of the probability of default and the loss given default. The investment grade
rating categories are similar to the category BBB-/Baa3 and above as defined
by S&P and Moody’s. Loans classified according to the bank regulatory
definitions as special mention, substandard and doubtful will have risk
ratings within the non-investment grade categories.