Citibank 2011 Annual Report Download - page 142
Download and view the complete annual report
Please find page 142 of the 2011 Citibank annual report below. You can navigate through the pages in the report by either clicking on the pages listed below, or by using the keyword search tool below to find specific information within the annual report.-
 1
1 -
2
-
3
-
4
-
5
-
6
-
7
-
8
-
9
-
10
-
11
-
12
-
13
-
14
-
15
-
16
-
17
-
18
-
19
-
20
-
21
-
22
-
23
-
24
-
25
-
26
-
27
-
28
-
29
-
30
-
31
-
32
-
33
-
34
-
35
-
36
-
37
-
38
-
39
-
40
-
41
-
42
-
43
-
44
-
45
-
46
-
47
-
48
-
49
-
50
-
51
-
52
-
53
-
54
-
55
-
56
-
57
-
58
-
59
-
60
-
61
-
62
-
63
-
64
-
65
-
66
-
67
-
68
-
69
-
70
-
71
-
72
-
73
-
74
-
75
-
76
-
77
-
78
-
79
-
80
-
81
-
82
-
83
-
84
-
85
-
86
-
87
-
88
-
89
-
90
-
91
-
92
-
93
-
94
-
95
-
96
-
97
-
98
-
99
-
100
-
101
-
102
-
103
-
104
-
105
-
106
-
107
-
108
-
109
-
110
-
111
-
112
-
113
-
114
-
115
-
116
-
117
-
118
-
119
-
120
-
121
-
122
-
123
-
124
-
125
-
126
-
127
-
128
-
129
-
130
-
131
-
 132
132 -
 133
133 -
 134
134 -
 135
135 -
 136
136 -
 137
137 -
 138
138 -
 139
139 -
 140
140 -
 141
141 -
 142
142 -
 143
143 -
 144
144 -
 145
145 -
 146
146 -
 147
147 -
 148
148 -
 149
149 -
 150
150 -
 151
151 -
 152
152 -
153
-
154
-
155
-
156
-
157
-
158
-
159
-
160
-
161
-
162
-
163
-
164
-
165
-
166
-
167
-
168
-
169
-
170
-
171
-
172
-
173
-
174
-
175
-
176
-
177
-
178
-
179
-
180
-
181
-
182
-
183
-
184
-
185
-
186
-
187
-
188
-
189
-
190
-
191
-
192
-
193
-
194
-
195
-
196
-
197
-
198
-
199
-
200
-
201
-
202
-
203
-
204
-
205
-
206
-
207
-
208
-
209
-
210
-
211
-
212
-
213
-
214
-
215
-
216
-
217
-
218
-
219
-
220
-
221
-
222
-
223
-
224
-
225
-
226
-
227
-
228
-
229
-
230
-
231
-
232
-
233
-
234
-
235
-
236
-
237
-
238
-
239
-
240
-
241
-
242
-
243
-
244
-
245
-
246
-
247
-
248
-
249
-
250
-
251
-
252
-
253
-
254
-
255
-
256
-
257
-
258
-
259
-
260
-
261
-
262
-
263
-
264
-
265
-
266
-
267
-
268
-
269
-
270
-
271
-
272
-
273
-
274
-
275
-
276
-
277
-
278
-
279
-
280
-
281
-
282
-
283
-
284
-
285
-
286
-
287
-
288
-
289
-
290
-
291
-
292
-
293
-
294
-
295
-
296
-
297
-
298
-
299
-
300
-
301
-
302
-
303
-
304
-
305
-
306
-
307
-
308
-
309
-
310
-
311
-
312
-
313
-
314
-
315
-
316
-
317
-
318
-
319
-
320
 |
 |

120
Since none of the Company’s reporting units are publicly traded,
individual reporting unit fair value determinations cannot be directly
correlated to Citigroup’s stock price. The sum of the fair values of the
reporting units at July 1, 2011 exceeded the overall market capitalization
of Citi as of July 1, 2011. However, Citi believes that it was not meaningful
to reconcile the sum of the fair values of its reporting units to its market
capitalization during the 2011 annual impairment test due to the fact
that Citi’s market capitalization reflects the execution risk in a transaction
involving Citigroup due to its size. The individual reporting units’ fair values
are not subject to the same level of execution risk or a business model that is
perceived to be complex.
See also Note 18 to the Consolidated Financial Statements.
Income Taxes
Citi is subject to the income tax laws of the U.S., its states and local
municipalities and the foreign jurisdictions in which Citi operates. These
tax laws are complex and are subject to differing interpretations by the
taxpayer and the relevant governmental taxing authorities. Disputes over
interpretations of the tax laws may be subject to review and adjudication by
the court systems of the various tax jurisdictions or may be settled with the
taxing authority upon audit.
In establishing a provision for income tax expense, Citi must make
judgments and interpretations about the application of these inherently
complex tax laws. Citi must also make estimates about when in the future
certain items will affect taxable income in the various tax jurisdictions, both
domestic and foreign. Deferred taxes are recorded for the future consequences
of events that have been recognized in the financial statements or tax
returns, based upon enacted tax laws and rates. Deferred tax assets (DTAs)
are recognized subject to management’s judgment that realization is more
likely than not.
At December 31, 2011, Citi had recorded net DTAs of approximately
$51.5 billion, a decrease of $0.6 billion from $52.1 billion at December 31, 2010.
Although realization is not assured, Citi believes that the realization of the
recognized net DTA of $51.5 billion at December 31, 2011 is more likely than
not based upon expectations as to future taxable income in the jurisdictions
in which the DTAs arise and based on available tax planning strategies (as
defined in ASC 740, Income Taxes) that would be implemented, if necessary,
to prevent a carryforward from expiring.
In general, Citi would need to generate approximately $111 billion of
taxable income during the respective carryforward periods (discussed below)
to fully realize its U.S. federal, state and local DTAs. Citi’s net DTAs will
decline primarily as additional domestic GAAP taxable income is generated.
As of December 31, 2011, Citi was no longer in a three-year cumulative
loss position for purposes of evaluating its DTAs. While this removes a
significant piece of negative evidence in evaluating the need for a valuation
allowance, Citi will continue to weigh the evidence supporting its DTAs. Citi
has concluded that there are two pieces of positive evidence that support the
full realizability of its DTAs. First, Citi forecasts sufficient taxable income in
the carryforward period, exclusive of tax planning strategies. Second, Citi has
sufficient tax planning strategies, including potential sales of assets, in which
it could realize the excess of appreciated value over the tax basis of its assets.
The amount of the DTAs considered realizable, however, is necessarily subject
to Citi’s estimates of future taxable income in the jurisdictions in which it
operates during the respective carry-forward periods, which is in turn subject
to overall market and global economic conditions.
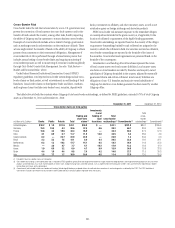
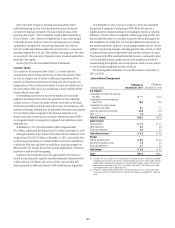
The following table summarizes Citi’s net DTAs balance at December 31,
2011 and 2010:
Jurisdiction/Component
In billions of dollars
DTA balance
December 31, 2011
$4!æBALANCE
$ECEMBERææ
U.S. federal (1)
#ONSOLIDATEDæTAXæRETURNæNETæOPERATINGæ
LOSSæ./, $—
#ONSOLIDATEDæTAXæRETURNæFOREIGNæTAXææ
CREDITæ&4# 15.8
#ONSOLIDATEDæTAXæRETURNæGENERALæ
BUSINESSæCREDITæ'"# 2.1
&UTUREæTAXæDEDUCTIONSæANDæCREDITS 23.0
/THERæ 1.4
Total U.S. federal $42.3
State and local
.EWæ9ORKæ./,S $ 1.3
/THERæSTATEæ./,S 0.7
&UTUREæTAXæDEDUCTIONS 2.2
Total state and local $ 4.2
Foreign
!0"ææSUBSIDIARYæ./,S $ 0.5
.ON!0"ææSUBSIDIARYæ./,S 1.8
&UTUREæTAXæDEDUCTIONS 2.7
Total foreign $ 5.0
Total $51.5
æ )NCLUDEDæINæTHEæNETæ53æFEDERALæ$4!SæOFææBILLIONæATæ$ECEMBERæææAREæDEFERREDæTAXæLIABILITIESæ
OFææBILLIONæTHATæWILLæREVERSEæINæTHEæRELEVANTæCARRYFORWARDæPERIODæANDæMAYæBEæUSEDæTOæSUPPORTæTHEæ$4!Sæ
ANDææBILLIONæINæCOMPENSATIONæDEDUCTIONSæTHATæREDUCEDæADDITIONALæPAIDINæCAPITALæINæ*ANUARYææ
ANDæFORæWHICHæNOæADJUSTMENTæTOæSUCHæ$4!SæISæPERMITTEDæATæ$ECEMBERæææBECAUSEæTHEæRELATEDæ
STOCKæCOMPENSATIONæWASæNOTæYETæDEDUCTIBLEæTOæ#ITI
æ )NCLUDESææBILLIONæANDææBILLIONæFORææANDææRESPECTIVELYæOFæTAXæCARRYFORWARDSæRELATEDæ
TOæCOMPANIESæTHATæFILEæ53æFEDERALæTAXæRETURNSæSEPARATEæFROMæ#ITIGROUPSæCONSOLIDATEDæ53æFEDERALæTAXæ
RETURN